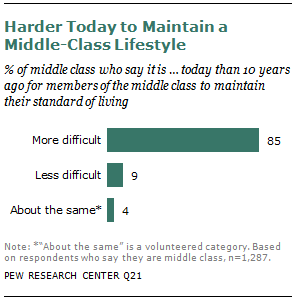
Over the past decade, the Great Recession, a housing market collapse, an unemployment surge and an anemic recovery have squeezed the middle class. An overwhelming majority of middle-class Americans (85%) say it is more difficult today than 10 years ago for those in the middle class to maintain their standard of living, according to a Pew Research Center national survey of 2,508 adults.
And it’s not just the middle class that feels this way. Some 82% of the self-described upper class and 87% of those who consider themselves in the lower class agree that it’s harder today for middle-class Americans.
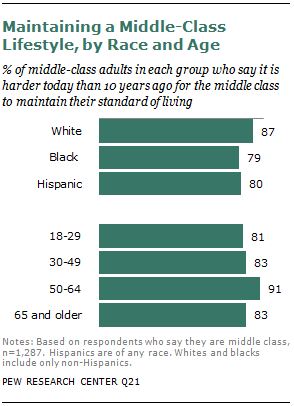
Within the middle class, the downbeat assessment is shared by virtually identical proportions of men and women, Republicans and Democrats, the college-educated and those with a high school degree or less. However, there are some notable differences by race and age.
Middle-class whites are more likely than middle-class blacks to say it is harder today to maintain a middle-class lifestyle (87% vs. 79%). Also, those in the middle class who are ages 50 to 64—adults in their prime earning years—are more likely than those younger than 30 (91% vs. 81%) or older than 65 (83%) to say that maintaining a middle-class lifestyle is harder now than a decade ago.
Who’s to Blame?
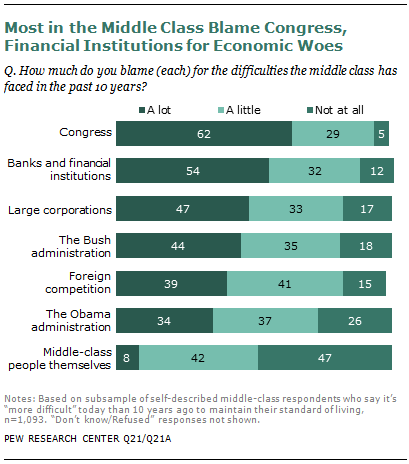
Those who say the middle class faces increased difficulties today were asked how much they blame each of seven institutions or groups for the economic problems of the past decade. Congress led the list: Among the middle class, about six-in-ten (62%) blame lawmakers “a lot” for the problems of the middle class. Somewhat smaller shares blame banks and financial institutions (54%) and large corporations (47%). An additional 39% say foreign competition is at fault. The Bush administration is held more accountable than the Obama presidency (44% vs. 34%), the survey found.
One group that the middle class does not hold responsible for its economic problems: the middle class itself. Only 8% say it bears “a lot” of the blame.
The Demographics of Blame
Different demographic groups within the middle class point the finger of blame in different directions. For example, men are more likely than women to blame Congress (68% vs. 58%) for the economic problems of the middle class. Blacks are more likely than whites to blame large corporations for the economic woes of the past decade (57% vs. 45%). About four-in-ten blacks (41%) and 34% of Hispanics say foreign competition is a major cause of these problems. Whites are more likely than Hispanics to say Congress is at serious fault (65% vs. 52%) for middle-class difficulties.
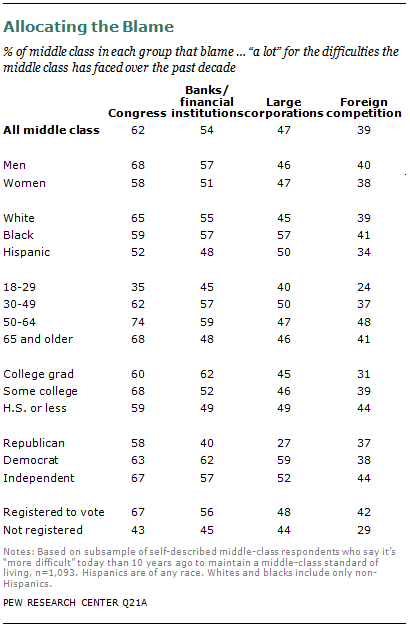
Young middle-class adults are significantly less likely than older generations to say that Congress and foreign competition are major causes of economic problems of the middle class.
Most notably, only about a third (35%) of 18- to 29-year-olds in the middle class blame Congress “a lot” for these problems, compared with 62% of 30- to 49-year-olds, 74% of 50- to 64-year-olds and 68% of those 65 and older.
Political Partisanship and Blame
The partisan and ideological debates that have grown louder this presidential year echo sharply throughout these results.
Among the middle class, about six-in-ten (59%) Democrats but only 27% of Republicans blame large corporations for middle-class economic difficulties—that difference of 32 percentage points is one of the largest ones measured in any of the demographic groups analyzed. Democrats also are far more likely than Republicans to say banks and financial institutions played a major role in these problems (62% vs. 40%).
But there is no significant partisan difference in views toward Congress: 58% of Republicans and 63% of Democrats agree that the nation’s lawmakers bear “a lot” of the blame for the economic troubles of the middle class over the past 10 years. If anything, political independents appear to be more critical of Congress than members of either party; two-thirds of independents (67%) say Congress is a major cause of middle-class problems, though the differences fall just short of being statistically significant.
And some potentially bad news for members of Congress seeking re-election: Middle-class registered voters are much more likely than those who are not registered to vote to blame Congress “a lot” (67% vs. 43%).
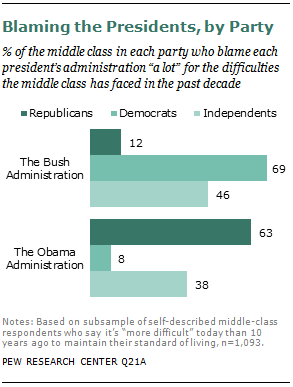
The partisan gap opens up when middle-class Republicans and Democrats are asked how much they blame each of the two most recent presidents for the financial difficulties of the middle class.
Two-thirds of Democrats (69%) but only 12% of Republicans say the Bush administration deserves a lot of blame for the economic problems the middle class has faced in the past 10 years. The judgments reverse when the lens shifts to the Obama administration: More than six-in-ten Republicans (63%) but just 8% of Democrats blame the current president “a lot.” Among middle-class independents, 46% blame Bush and 38% blame Obama.
The Middle Class Over Time
The Pew Research survey posed a battery of questions designed to gauge the economic attitudes and experiences of middle-class Americans over various time periods. The findings are mixed. While a sizable majority of respondents (71%) say it is more difficult to get ahead today than it was 10 years ago, they are evenly divided when it comes to measuring their own personal economic progress over the past decade. Some 42% say they are less financially secure, while 44% say they are more secure and 12% say there has been no change.
Asked about the impact of the Great Recession, which lasted from December 2007 to June 2009, 42% of middle-class respondents say they still have not recovered financially, while nearly a third (32%) say they are in better shape now, and 23% are doing no better or worse than before the downturn.
Asked about their experiences in the past year, about six-in-ten report they have had to cut back household spending in the past 12 months because money was tight. Roughly three-in-ten in the middle class say they had trouble paying their bills, and 12% say they lost their jobs.
The remainder of this chapter offers more detail on these and related findings. The first sections examine how middle-class Americans say they have fared financially over the past 10 years, including how well they have bounced back from the Great Recession. The next section examines how Americans have fared in the past year. The final section describes how people in the middle class judge their current financial circumstances as well as their family life, education and housing situations.
Financial Security and Social Class
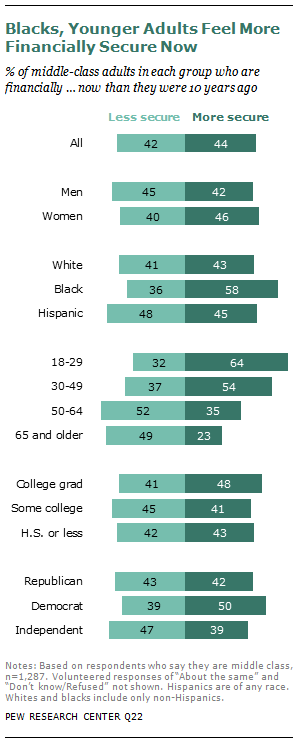
The middle class divides nearly equally when asked if they are more secure financially now than a decade ago. Four-in-ten (42%) say they are less secure now than 10 years ago, while about as many (44%) say they are more sheltered from economic shocks.
In terms of their financial security, different demographic groups within the middle class say they have headed in opposite directions in the past decade. Majorities of blacks and those under the age of 50 say they are more secure now. In contrast, older adults are more likely to say their sense of economic well-being has worsened over the past 10 years. Democrats are more likely to say they are more secure than independents (50% vs. 39%). About four-in-ten Republicans (42%) also feel more protected now.
According to the Pew Research survey, middle-class blacks say that they are more financially secure now than they were a decade ago. Nearly six-in-ten (58%) say they are more secure today while about a third say they are less secure.
In contrast, the experience of middle-class whites and Hispanics is more mixed. About four-in-ten whites (43%) say they are more secure—and 41% feel more vulnerable today. A similar share of Hispanics (45%) say they are more secure, while nearly half (48%) say they are less protected.
About half of all middle-class adults ages 50 and older say they feel less financially protected today than a decade ago. In contrast, nearly six-in-ten younger adults say they are more secure now than they were. 9
Members of the middle class who are near or approaching retirement age are particularly downbeat: About half of those ages 50 to 64 (52%) say they are less economically secure now than 10 years ago, while 35% feel more insulated from financial shocks. These sour views are consistent with other research. As earlier Pew Center reports have documented, these “gloomy boomers” were among the demographic groups hit hardest by the recession and housing market collapse.
Education offers little or no protection from economic reversals, the survey suggests. About half of middle-class college graduates (48%) and 43% of those with less formal education say that they are more financially secure than they were 10 years ago.
Democrats are more likely than political independents to say they are more financially protected now than they were 10 years ago. (50% of Democrats vs. 39% of independents). About four-in-ten Republicans (42%) say the same.
Harder to Get Ahead
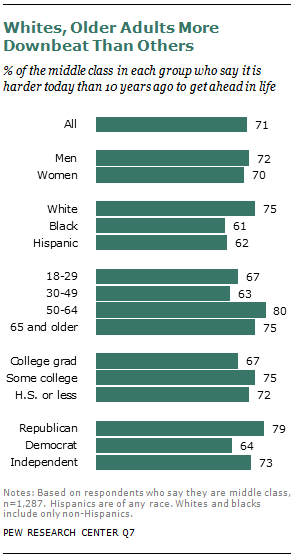
Seven-in-ten middle-class adults (71%) say it is harder to get ahead now than it was 10 years ago, an increase of nine percentage points since this question was asked in a 2008 Pew Research survey.10
Substantial majorities of every core demographic group in the middle class say it is harder to get ahead today than it was a decade ago. But some notable differences between groups do emerge. Whites, older adults and Republicans are more likely than non-whites, those younger than 50 and Democrats to say that it is more difficult to advance.
The racial pattern seen in other questions appears again here. Three-quarters of all middle class whites (75%) say it is more difficult now to move forward. In contrast, about six-in-ten blacks (61%) and Hispanics (62%) believe advancement is harder.
Also, older middle-class adults are more negative than the younger generations. Nearly eight-in-ten (78%) of those 50 years old and older say it is more difficult to get ahead, compared with 65% of younger middle-class adults.
Views on advancement are strongly correlated with political partisanship. About eight-in-ten Republicans (79%) but fewer than two-thirds of Democrats (64%) say it’s tougher now to make progress in life than it was a decade ago. Independents fall between the two partisan camps: 73% of all unaligned adults say it is more difficult to move forward.
But differences are either small or non-existent between other key demographic groups. Virtually identical proportions of men (72%) and women (70%) say it is harder to get ahead. And college graduates are about as likely as those with a high school education or less to believe that there are more roadblocks to advancement now than 10 years ago (67% vs. 72%).
In the Wake of the Great Recession
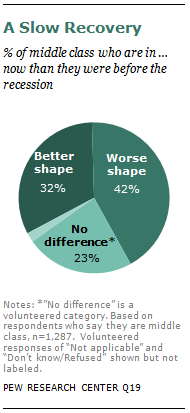
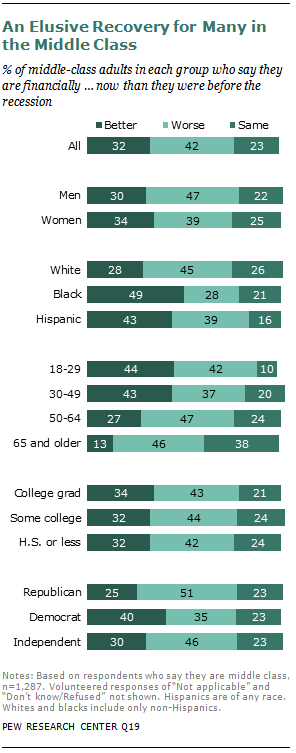
The Great Recession lasted 18 months. But three years after the downturn officially ended, about four-in-ten (42%) middle-class adults say they are worse off financially today than when the recession began in December 2007. An additional 23% say they are doing about as well as they were before the downturn. About a third report they are at least a little better off.
The perceived pace of recovery varies among demographic groups. Men, whites, Republicans, and middle-aged and older adults are more likely than women, non-whites, Democrats and younger adults to say they have not yet recovered from the recession.
About half of all middle-class men (47%) say they are not yet back financially to where they were before the recession. By comparison, about four-in-ten (39%) women say they are worse off now.
Middle-class blacks and Hispanics are significantly more likely than whites to say they are doing better financially now than before the slowdown. About half of blacks (49%) and 43% of Hispanics say they are doing better, compared with only 28% of whites. In addition, a plurality of whites (45%) say they are doing worse, compared with 28% of blacks and 39% of Hispanics.
Adults younger than 50 are twice as likely as those 50 and older to say they are doing better (43% vs. 20%). But this generation gap narrows when the focus shifts to those who say they are doing worse. Nearly four-in-ten middle-class adults ages 30 to 49 (37%) say they are not doing as well as they were before the recession, compared with 47% of those 50 to 64 years old.
Republicans and political independents say they have been the slowest to recover: About half (51%) of all middle-class Republicans say they have not fully made up their recession-era losses, and nearly as many independents say the same thing (46%).
In contrast, four-in-ten Democrats (40%) say they now stand on higher ground financially than they did before the downturn. About a third (35%) are still not fully recovered, while 23% say they now are in the same shape financially as they were before the recession.
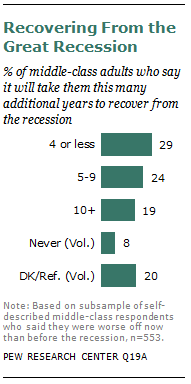
Among those in the middle class who say they haven’t yet recovered, about three-in-ten (29%) say it will take four years or less for them to get back to where they were before the recession. An additional 24% expect it will take five to nine years, while 19% say 10 years or more. Eight percent say they expect to never fully recover from the Great Recession, and an additional 20% say they are unsure or do not know how long it will take.
Differences by Social Class
As noted at the beginning of this chapter, Americans in the upper, middle and lower classes agree that maintaining a middle-class lifestyle is more difficult today than 10 years ago. But on other key economic questions, predictable differences emerge among the social classes, with the upper class faring better and those in the lower class faring worse.
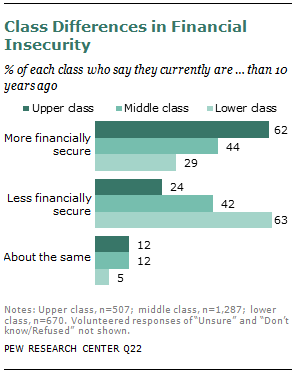
For example, even after the Great Recession, the stock market meltdown and the collapse of the housing market, a majority of upper-class adults say they are more financially secure now than they were a decade ago (62%). In contrast, 63% of lower-class adults say they are less financially secure now. The middle class, true to its name, straddles the middle—44% say they are more secure, while 42% say they are less secure.
Similarly, those in the lower class say they were hit the hardest by the Great Recession. About six-in-ten (58%) say they are not yet back to where they were financially before the recession began. Among upper-class Americans, only about a third (34%) say they are worse off while 42% report that they are in better financial shape now.
Belief in the American Dream Shaken but Still Standing
The “lost decade” has shaken but not shattered the public’s belief that anyone can get ahead with hard work and determination.
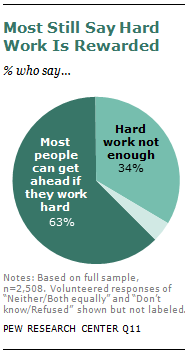
More than six-in-ten adults (63%), including 67% of the middle class, agree that “most people can get ahead if they are willing to work hard,” while about a third (34%) believe that “hard work and determination are no guarantee of success.”
However, substantial differences by social class exist. Among those in the lower class, only about half say hard work and determination bring success, while roughly as many (45%) disagree. Many more in the upper class (71%) and middle class (67%) express confidence that persistence and effort eventually pay off.
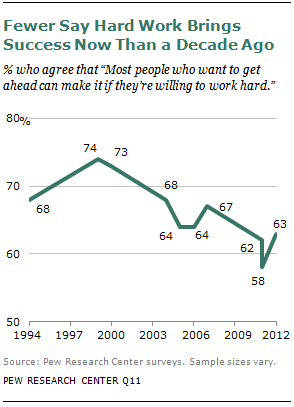
This question has been asked 10 times in Pew Research surveys since 1994, when 68% agreed that hard work would bring success. The percentage peaked in 1999 when about three-quarters (74%) offered the affirmative view.
The next 10 years were marked by an erratic but generally downward drift in this measure, which bottomed out in December 2011, when 58% agreed that hard work would be rewarded and 40% disagreed. While the current five-point uptick since the December survey is a statistically significant increase in positive responses, it is too soon to tell whether this marks the beginning of an upward trend.
Experiences Over the Past Year
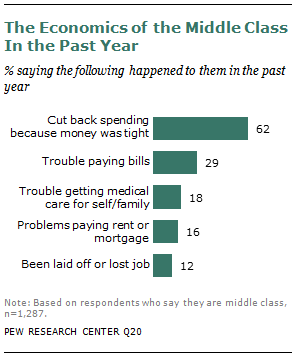
Though the Great Recession officially ended in June 2009, the middle class has still experienced economic hardships over the past year. About six-in-ten middle-class adults (62%) say they had to cut back household spending in the past year because money was tight. Three-in-ten (29%) had trouble paying their bills. Just under two-in-ten had trouble getting or paying for medical care for themselves or someone in their family (18%), and a similar share had trouble paying their rent or mortgage (16%). And fully 12% have been laid off or lost their job in the past year.
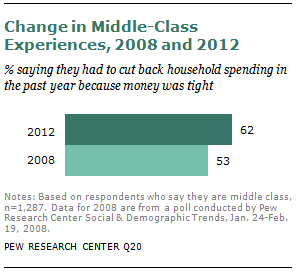
In a January 2008 Pew Research survey, a smaller share of the middle class said they had cut back spending during the previous year. Fully 53% said they had to cut back spending in the year preceding January 2008, while in the current survey, 62% said so about the year preceding July 2012. However, on other measures of economic stress tested in this battery of questions—inability to pay for medical care; job loss; trouble paying for housing—the share of middle-class respondents reporting problems has not risen significantly over the past four years. 11
Middle-Class Experiences Over the Past Year
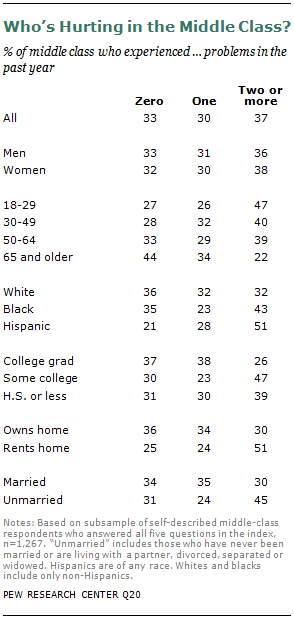
The number of negative economic experiences over the past year varies among different subgroups in the middle class.
Middle-class adults younger than 65 are more likely than those ages 65 and older to have experienced two or more of these economic hardships in the past year. In contrast, those 65 and older are less likely than all younger age groups to say they didn’t experience any of these things.
Hispanics (51%) in the middle class are more likely than whites (32%) to say they have experienced two or more economic struggles. The black share (43%) falls in between the shares of whites and Hispanics.
Middle-class individuals with only some college (47%) or who had a high school diploma or less (39%) were more likely than those with a bachelor’s degree or more (26%) to say that they experienced two or more of the economic hardships.
Homeownership is also correlated with the number of negative economic experiences one had over the past year. Homeowners (30%) are less likely than renters (51%) to have encountered two or more of these hardships. In the measure that relates directly to housing—difficulty paying rent or mortgage over the past year—renters are almost three times as likely as homeowners to say this was a problem (29% vs. 10%).
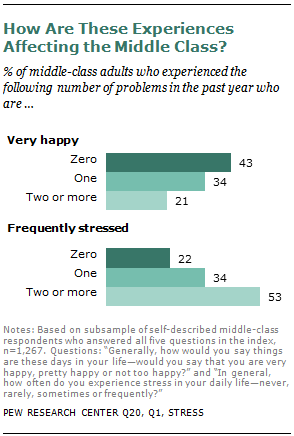
These negative economic experiences are correlated with the happiness and stress level of the middle class. Those who reported two or more economic problems in the past year are less likely to say they are “very happy” these days (21%) than those who had only one economic problem (34%) or no economic problems (43%).
And the number of economic problems is also related to the level of stress in one’s daily life. Those who had no economic problems in the past year are the least likely to say they experience stress frequently in their daily lives (22%). Those who experienced two or more economic hardships are the most likely to be frequently stressed (53%).
Experiences of the Lower, Middle and Upper Classes
Not surprisingly, there are large differences in each of these economic hardships across the three class groups, with the upper class significantly less likely than the middle class to have experienced them over the past year and the lower class being significantly more likely.
Among the largest differences between the upper and middle classes is the share that had to cut back household spending over the past year because money was tight: 62% of middle-class adults had to do so, compared with only 41% of upper-class adults (a difference of 21 percentage points). Fully 84% of the lower class had to do this.
Overall, the gaps in experiences between the middle and the lower class are larger than the gaps between the upper and the middle class. Among the largest gaps between the lower and the middle class is the share that had trouble paying bills over the past year. Nearly two-thirds of the lower class (64%) experienced this problem, while only about three-in-ten (29%) of the middle class and 13% of the upper class say the same.
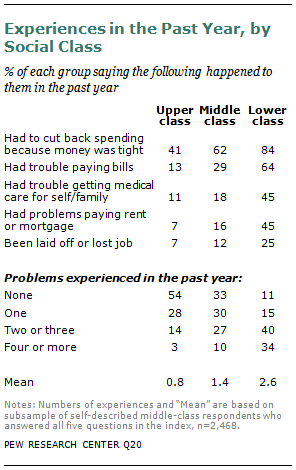
While 45% of lower-class adults had trouble getting medical care for themselves or their family, only 18% of middle-class adults and 11% of upper-class adults say the same. The shares that had trouble paying rent or mortgage follow a similar pattern: 45% of the lower class experienced this problem, compared with a much lower share of the middle class (16%) or the upper class (7%).
One-quarter of those who say they are in the lower class (25%) say they have been laid off or lost their job over the past year. This compares with only 12% of the middle class and 7% of the upper class.
Another way of looking at these items is by compiling the number of bad economic experiences over the past year into an index. One-third of middle-class adults (33%) didn’t have any of these economic problems in the past year, compared with about half of upper-class adults (54%) and 11% of lower-class adults.
Among the middle class, three-in-ten (30%) report exactly one negative economic experience in the past year, about a quarter (27%) say they experienced two or three, and one-in-ten (10%) experienced four or more.
Among the upper class, the share that experienced just one of these economic hardships (28%) is about equal to that of the middle class, but the shares that experienced two or three of them (14%) or four or more (3%) are significantly lower than the middle class.
Among the lower class, the story is reversed. The share of the lower class that says they experienced only one of these economic hardships (15%) is smaller than either the middle or the upper class. But the shares who experienced two or three (40%) or four or more (34%) are significantly larger.
How Satisfied Is the Middle Class?
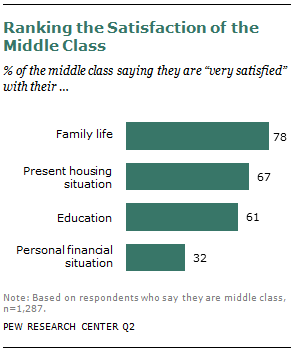
Given the struggles many have faced over the past year, it may not come as a surprise that a relatively low share of middle-class adults are satisfied with their personal financial situation. Only about one-third of people in the middle class (32%) say they are “very satisfied” with their personal financial situation, 40% say they are “somewhat satisfied,” and about one-quarter say they are “very” (10%) or “somewhat” (16%) dissatisfied. In other aspects of their lives, however, the middle class is much more upbeat.
For example, roughly three-quarters (78%) say they are very satisfied with their family life, 16% say they are somewhat satisfied, and only 5% say they are either very or somewhat dissatisfied with their family life.
Two-thirds of middle-class adults (67%) are very satisfied with their present housing situation. An additional 23% say they are somewhat satisfied, and about one-in-ten (9%) say they are either very or somewhat dissatisfied with their home.
When it comes to their education, six-in-ten people in the middle class (61%) are very satisfied, three-in-ten (28%) are somewhat satisfied, and only 9% are very or somewhat dissatisfied with their education
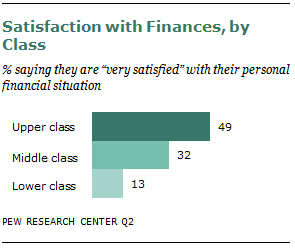
The three social classes follow a clear pattern in their overall satisfaction across all these measures, with the upper class rating their satisfaction the highest, followed by the middle and then the lower class. This is true of the share saying they are very satisfied with their family life, present housing situation and education. The largest gaps among the three classes occur in satisfaction with their personal financial situations.
Half of those in the upper class (49%) say they are “very satisfied” with their personal financial situation, compared with only one-third of those in the middle class (32%). The lower class falls well behind the middle class, with only 13% saying they are very satisfied with their finances.
Who’s Satisfied in the Middle Class?
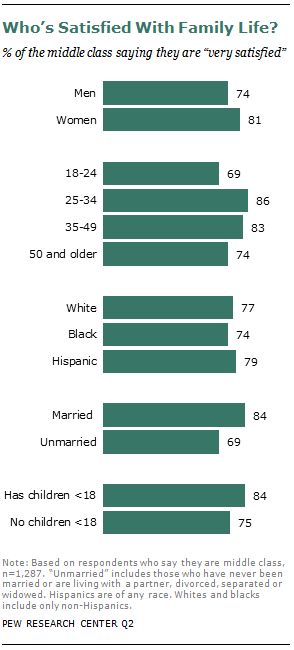
When it comes to family life, every major demographic group within the middle class has high levels of satisfaction. Overall, 78% of the middle-class adults are “very satisfied” with their family life. Satisfaction is not significantly different between men and women or among whites, blacks and Hispanics. However, there are some groups who rate their satisfaction with family life higher than others.
Middle-class adults in the prime ages for marriage and childbirth are happier than both younger and older adults. Those ages 25 to 34 (86%) and ages 35 to 49 (83%) are significantly more likely to say they are very satisfied with their family life than are adults ages 18 to 24 (69%) and adults ages 50 and older (74%).
Along these same lines, married people in the middle class are more likely than unmarried people to be very satisfied with their family life (84% vs. 69%), and people with children younger than 18 are more likely to be very satisfied than those who don’t have young children (84% vs. 75%).
Among married people in the middle class, there is no difference in terms of family satisfaction between families in which one spouse in employed (85%) and those in which both spouses are employed (86%).
But among parents with young children, marital status appears to play a key role in one’s satisfaction with family life. Almost all married parents with young children (91%) are very satisfied with their family lives, compared with only 68% of unmarried parents with young children.
Satisfaction with Housing
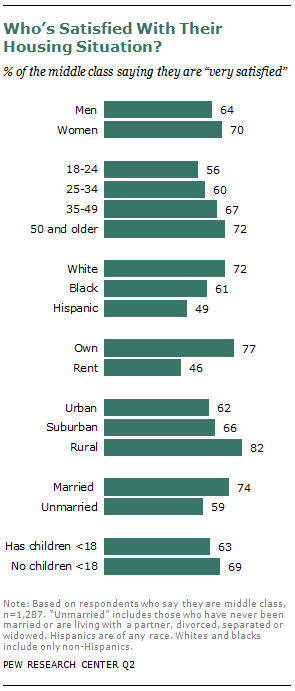
When asked about satisfaction with their present housing situation, two-thirds of the middle class (67%) say they are very satisfied.
Responses to this question vary significantly by whether one is a homeowner or renter. About three-quarters of those who own their home (77%) are “very satisfied” with their present housing situation, compared with just 46% of renters.
Also, adults younger than 35 are less satisfied than older adults with their present housing situation. Only about six-in-ten adults ages 18 to 34 (58%) are very satisfied with their housing situation, compared with 70% of adults ages 35 and older.
Whites in the middle class (72%) are more likely than blacks (61%) or Hispanics (49%) to be very satisfied with their current housing situation.
Those who live in rural areas (82%) are more likely than those in suburban (66%) or urban (62%) areas to be very satisfied with their housing situation.
Marital status is also related to home satisfaction. A greater share of those who are married (74%) than those who are unmarried (59%) are very satisfied. But there are no significant differences between those with young children (63%) and those without children (69%).
The different levels of housing satisfaction across many of these groups appear to be related to their levels of homeownership, as owning one’s home was among the strongest indicators of satisfaction. For example, roughly seven-in-ten whites in the middle class (73%) are homeowners, compared with only 49% of blacks and 39% of Hispanics. And the homeownership rate among married people (86%) is about double the rate among unmarried people (41%).
But homeownership rates are not the only factor at play. Even though middle-class people in rural areas are more satisfied than those in suburban areas, their homeownership rates are roughly equal (74% of people in rural areas and 70% of those in suburban areas are homeowners). And those in the suburbs and urban areas have equal levels of satisfaction, even though urbanites have a lower homeownership rate (55%). Furthermore, the difference in homeownership rates among those who have children (76%) and those who do not (36%) does not result in differing levels of satisfaction in one’s present housing situation.
Satisfaction with Education
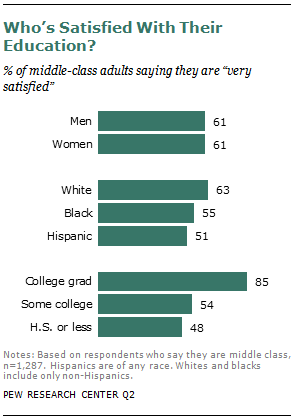
Overall, 61% of middle-class adults are “very satisfied” with their education, including 85% of those with at least a bachelor’s degree. This compares with about half (54%) of those with some college or a two-year associate degree and48% of those with a high school diploma or less.
There are few to no differences in satisfaction with education in the middle class based on gender, age or marital status. But in terms of race, whites (63%) are more likely to be very satisfied with their education than Hispanics (51%). This is not surprising, given that middle-class whites (34%) are almost three times as likely as middle-class Hispanics (12%) to have a college education.
Satisfaction with Finances
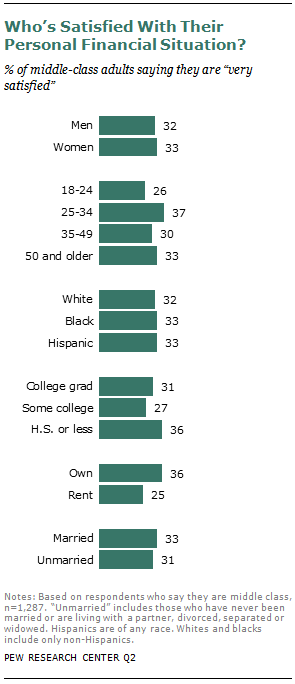
Satisfaction with one’s personal financial situation ranks the lowest among the four measures. Only 32% of the middle class is “very satisfied” with their finances.
There are very few demographic differences in satisfaction with personal financial situation among the middle class.
Only one major demographic—homeownership—is related to satisfaction with finances. Among homeowners, 36% say they are very satisfied with their personal financial situation, compared with 25% of renters.
Satisfaction with finances is more concretely tied to evaluations of one’s financial growth over time.
Among those in the middle class who feel their personal financial situation is more secure or about the same as it was 10 years ago, 44% now say they are “very satisfied” with their personal financial situation. Among those who feel less secure than 10 years ago, only 17% are very satisfied with their finances today.


