Households Owing Debt
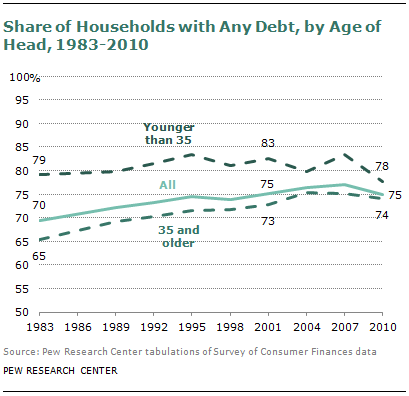
Analysis of the Survey of Consumer Finances indicates that the median debt of households headed by those younger than 35 fell from 2001 ($17,938) to 2010 ($15,473). The median debt of older households rose. The decline in the median debt of young adult households partly reflects that fewer young adult households had any debt at all. In 2001, 83% of young adult households owed a debt. By 2010, only 78% of young adult households reported an outstanding debt. The Federal Reserve has been collecting the SCF on a triennial basis since 1983. The incidence of household debt among young adults in 2010 (78%) is the lowest level observed since 1983. In 1983, 79% of young adults households reported having any outstanding debt. By contrast, among households headed by those 35 and older the share having any debt rose over the decade (from 73% in 2001 to 74% in 2010) and since 1983 (65%).4
Debt Unrelated to Residential Property
The vast majority of household debt involves debt secured by residential property. Debt not tied to residential property includes installment debt (such as student debt and vehicle loans) and credit card debt. Much of the decline in debt among younger households is due to the fact that they are less likely to own homes and have a mortgage than they were in 2001. But the typical younger household also owes less debt that does not involve residential property (such as student debt and credit cards).
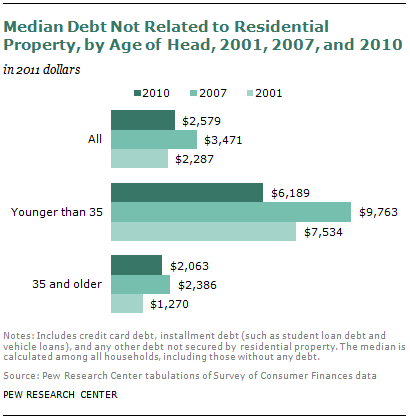
In 2001 the median level of debt not tied to residential property was $7,534 among households headed by a young adult. After rising to $9,763 in 2007, the median debt unrelated to property fell to $6,189 in 2010 among younger households.
By contrast, older households tend to have greater non-property-related debt than they did at the start of the decade. In 2001 the typical household with a head 35 and older owed $1,270 in debt not tied to property. By 2010 the median older household owed $2,063.
So, broadly speaking, younger households have shed debt over the decade and older households have become more indebted, and it goes beyond simply what has occurred in the housing market.
The Distribution of Debt
Returning to all debt, including debt secured by residential property, the median household debt among young adults declined from 2001 ($17,938) to 2010 ($15,473). The median household refers to the middle household, meaning that half of young adult households owed $15,473 or less in 2010 and half owed more than $15,473. The shortcoming of the median statistic is that debt, like wealth, is heavily concentrated. Some households have no debt, and a few households have accumulated very large amounts of debt. Given how skewed debt is across households, it is revealing to examine the distribution of debt and not just the median.
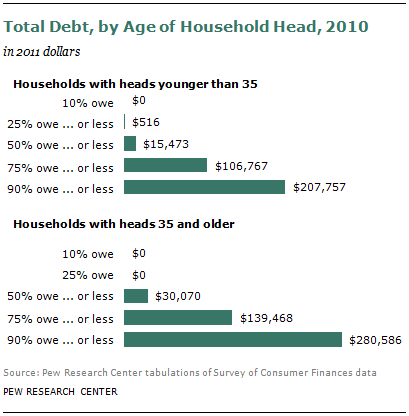
Among young adults, a quarter of households owed $516 or less to their creditors in 2010. Though half owed $15,473 or less, a significant segment of young adults had much larger amounts of debt. A quarter of young adult households owed at least $106,768, and the most indebted 10% owed at least $207,758.
The distribution of young adult debt did not decline uniformly from 2001 to 2010. In the lower half of the distribution, debt declined. For example, in 2001, 25% of young adult households owed $1,270 or less. By 2010 a quarter of young adults households owed $516 or less. But at the upper end of the debt distribution, more young adult households owed large amounts of debt. In 2001, the most indebted quarter of young adult households owed more than $85,880. By 2010, a quarter of young adult households owed more than $106,767.
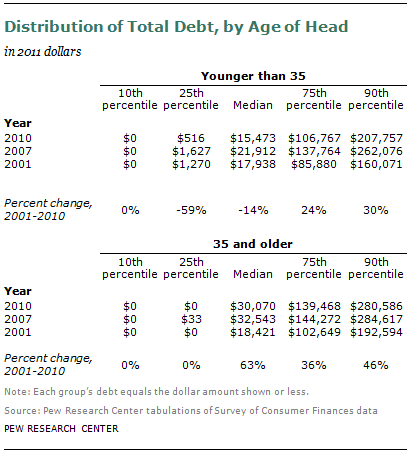
Among households with heads younger than 35, 56% of households saw either a decline in indebtedness or no change from 2001 to 2010, while the upper 44% of the distribution saw an increase in indebtedness. Thus the trend in indebtedness among young adult households from 2001 to 2010 partly depends on whether one focuses on the majority of households (indebtedness declined) or the more indebted slice of households (indebtedness rose). But comparing the indebtedness of older households to households headed by young adults, it pretty much is always the case that over the decade older households did not shed as much debt as (or became more indebted than) younger households.
For example, the median debt of households headed by a young adult fell 14% from 2001 to 2010, while it rose 63% among households headed by someone 35 and older. Focusing on the most indebted quarter of young adult households, debt increased 24% from 2001 ($85,880) to 2010 ($106,767). But among the most indebted quarter of older households, debt increased 36% from 2001 ($102,649) to 2010 ($139,468).
Uniformly across the distribution, debt tended to increase more for households age 35 and older than for young adult households from 2001 to 2010.
Fewer Young Adult Households Have a Mortgage
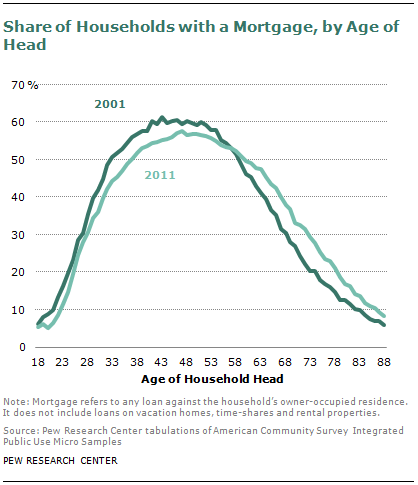
A major driver of the decline in indebtedness among young adults is that fewer of them have a home mortgage. The American Community Survey reveals the fraction of households who have a loan on their primary residence. In 2001 34% of households headed by those younger than 35 had a mortgage. By 2011 only 30% of young adult households had a mortgage. The ACS shows that households whose heads were up to about the age of 57 were less likely to have a mortgage in 2011 than in 2001. But households whose heads were age 58 and older were more likely to have a mortgage (or less likely to own their homes free and clear) in 2011 than in 2001. Generally, mortgage debt tends to be significantly greater than other types of debt such that these changing patterns of owing a mortgage account for why young adults tend to be less in debt over the decade but households headed by those 35 and older are more in debt.
Debt Compared to Household Income
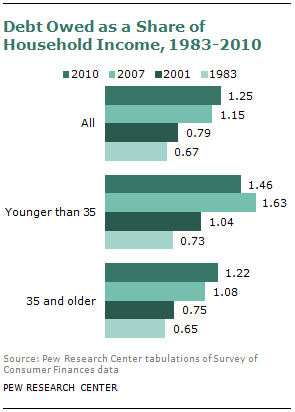
Measured at the median, households headed by those younger than 35 had less debt ($15,473) in 2010 than older households ($30,070). Debt is probably best not viewed in isolation, however, but in comparison to the economic resources of the household to service that debt. Younger adult households tend to have lower household incomes, and their household incomes have declined since 2001. Comparing the debt owed by younger households to their incomes, the debt-to-income ratio of younger households rose from 1.04 in 2001 to 1.63 in 2007.
Reflecting the decline in debt, the debt-to-income ratio of younger households declined since 2007 but still remains above 2001 levels. The debt-to-household income ratio of households 35 and older has risen since 2007 (from 1.08 to 1.22).
The Specifics of Debt
In the Survey of Consumer Finances the household’s total debt can be broken down into six separate types of debt: debt secured by residential property (including vacation homes and rental properties as well as the primary residence), vehicle loans, student loan debt, other installment debt (for example, for furniture or appliances), credit card debt (including debt on revolving store accounts and gasoline company cards), and other kinds of debt.
In the critically important category of debt against residential property, the share of young adult households owing such debt fell from 37% in 2001 to 35% in 2010, according to the Survey of Consumer Finances. Among households with heads age 35 and older, the incidence of debt against residential property increased from 49% in 2001 to 52% in 2010.
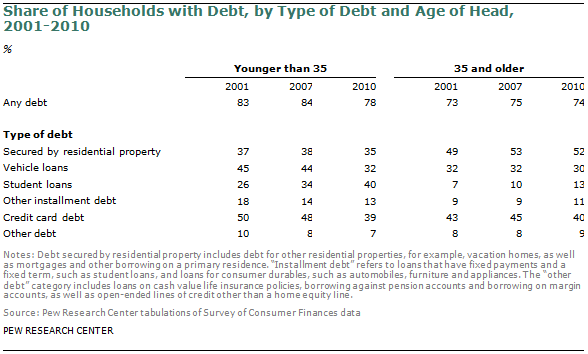
Vehicle loans have been a diminishing component of household debt over the decade, in part because fewer households owe vehicle debt. The incidence of vehicle debt markedly fell among households headed by those younger than 35. In 2001 45% of young adult households had outstanding vehicle loans. In 2010 only 32% of young adult households were repaying vehicle loans. The incidence of vehicle debt also dropped among households headed by those 35 and older, but not nearly as much. In 2010 30% of older households owed vehicle loans, down from 32% in 2001.
Similarly, the prevalence of outstanding credit card balances among young adult households was greatly reduced over the decade. In 2001, 50% of young adult households were carrying a credit card balance. By 2010 only 39% of young adult households carried a balance. Older households also scaled back the carrying of credit card balances, but not nearly as much. The incidence of credit card debt among households older than 35 fell from 43% in 2001 to 40% in 2010. At the start of the decade, young adult households were more likely than older households to carry credit card debt. By 2010 they were about equally likely as older households to carry such debt.
Student loan debt has been a growing component of total household debt (Fry, 2012; Federal Reserve Bank of New York, 2012), and both the incidence and outstanding amounts owed have been rising. The incidence of borrowing for education was up sharply for both younger and older households. By 2010 40% of households headed by a young adult had one or more outstanding student loans, up from 26% in 2001. Student loan obligations also nearly doubled in terms of prevalence among households headed by those 35 and older. In 2010, 13% of older households owed student loans, up from 7% in 2001.5
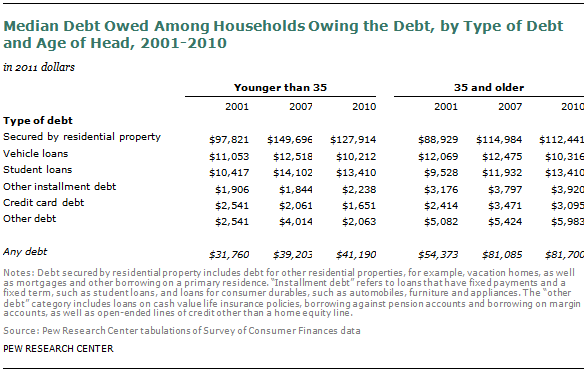
Examining the typical amounts of outstanding debt (if the household has that type of debt), the largest outstanding debts tend to be secured by residential property. The median amount owed on debt against residential property rose for both younger and older households from 2001 to 2010. Based on the median owed, the outstanding amount of vehicle loans fell over the decade for both younger and older households. Student loan balances were up, and they increased for both younger and older households. In regard to credit card debt, fewer young adult households carried balances, and the outstanding amounts owed fell over the decade. In 2001 the typical young adult household carrying a balance owed about $2,541. By 2010 the median credit card balance among those carrying a balance fell to $1,651. Older households increased their credit card indebtedness over the decade on the basis of the median amount owed. The typical older household owed $2,414 on credit cards in 2001. By 2010 the median outstanding credit card balance had risen to $3,095 among older households carrying a balance.
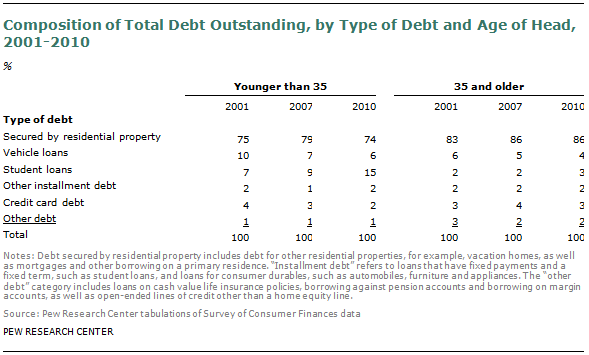
Among households with debt it is useful to summarize trends in debt by examining the composition of total debt. For both younger and older households, debt against residential property is far and away the most important debt component. Most debt owed is debt secured against property. But, interestingly, for younger households their student loan debt was the only type of debt that was rising as a share of total debt over the past decade. In 2001 outstanding student loan balances accounted for 7% of the total debt outstanding of households headed by young adults. Younger households over the decade were less likely to have mortgages, less likely to have car loans, and less likely to have credit card balances. Hence, by 2010 outstanding student loan debt accounted for 15% of the total debt owed by younger households. For older indebted households, student loan debt was not the only growing component of debt owed. Student loan debt rose from 2% to 3% of outstanding debt, but debt secured by residential property also grew in importance. In 2001 debt against property accounted for 83% of the outstanding debt of older households. By 2010 debt secured against residential property rose to 86% of the debt outstanding.
The Indebtedness of Young Adult Households
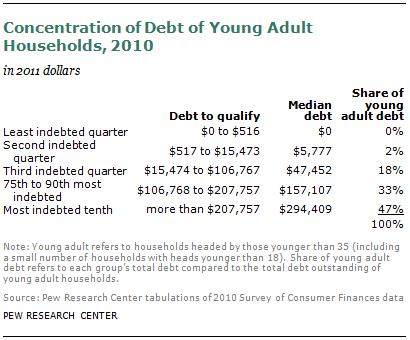
Finally, households headed by young adults, by some measures, were less indebted by 2010 but clearly in 2010 there were some young adult households who owed large amounts of debt. In 2010 the median household headed by a young adult owed $15,473 to its creditors. As discussed earlier, debt tends to be concentrated. Many households owe little, and a few owe very large sums. The most indebted fourth of young adult households owed at least $106,768 to creditors in 2010. The most indebted one-tenth of young adult households owed more than $207,757 to creditors. Of all the debt owed by households headed by a young adult in 2010, 79% was owed by the most indebted one-fourth of households. The most indebted one-tenth owed 47% of all the debt owed by young adult households. So one out of 10 households accounted for nearly half of all the debt.
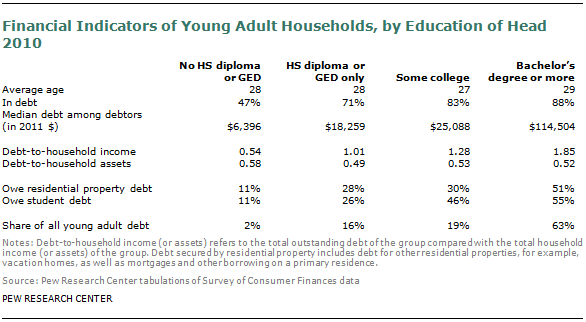
Generally, the more indebted young adult households were the households with the more educated heads. Among all young adult households, 78% were in debt in 2010. Among college-educated households, 88% were in debt, compared with 47% of those whose head had not completed high school. Of the households that were in debt, the typical household whose head had not finished high school owed $6,396. The median debt of the college-educated household in debt was $114,504. Debt shares reveal that most of the debt is owed by the more educated. Young adult households whose heads had not pursued any education beyond high school owed only 18% of all the outstanding debt. College-educated households owed 63% of all the outstanding debt.
Are the better-educated households more heavily indebted because of student loan debt? Partly, but there clearly are other more important factors. Better-educated households are more likely to have student loan debt; 55% of young adult households with a college-educated head had outstanding student loan debt in 2010. Only 11% of households whose head had not finished high school had student loan obligations. But, as we showed above, student loan debt is dwarfed by debt against residential property. The typical student loan obligation of a young adult household owing student loans was $13,410, while young adults owing debt on residential property typically owe $127,914. College-educated households are more in debt largely because they are more likely to own a home and have a mortgage balance — 51% of college-educated households have debt against residential property, compared with 11% of young adult households whose head has not finished high school.
Among young adults, less-educated households have a lot less debt, but they also have a lot less assets. The debt-to-asset ratio among households whose heads had not finished high school was 0.58. The better-educated households have more debt, but their debt-to-asset ratio is similar at 0.52, implying they tend to have a lot more assets as well.
So there are some young adult households that are very indebted. They tend to be the college-educated young adult households, and it is partly because they are much more likely to own their homes.