Wealthier households tended to gain most of the wealth created from 2009 to 2011 because they were much more likely to own the assets that rose the most in value. From 2009 to 2011, average net worth per household rose 14% overall. However, average net worth excluding home equity rose 31%, from $195,650 in 2009 to $255,843 in 2011. Much of the nation’s net worth excluding home equity is in financial assets, and the nation’s households with at least $500,000 of net worth were more likely to own financial assets, particularly the financial assets that rose the most in value from 2009 to 2011.
In 2009 households with at least $500,000 of net worth owned 72% of the nation’s aggregate net worth but 81% of the nation’s aggregate financial assets.
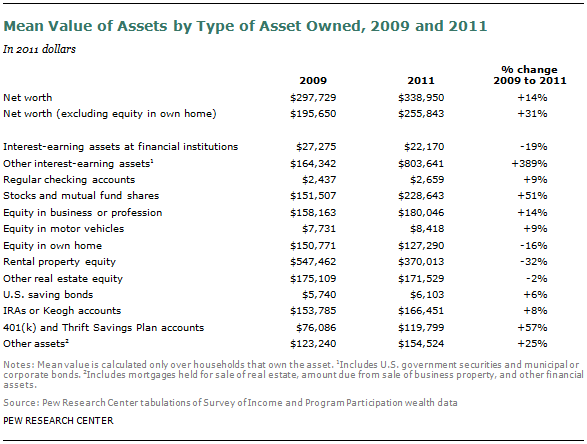
The Census Bureau reports the average value for specific assets among the households that own that specific asset. Very large gains in average holdings were reported for specific categories of financial assets. For example, the average value of 401(k) and Thrift Savings Plan accounts rose 57% from 2009 ($76,086) to 2011 ($119,799). The mean value of directly owned stocks and mutual funds rose 51% from 2009 to 2011. Among households owning assets in the category of “other interest-earning assets,” or direct owners of government securities or municipal and corporate bonds, the average holdings of those securities and bonds rose nearly fivefold from 2009 ($164,342) to 2011 ($803,641).
Average gains in other important asset categories paled by comparison. Reflecting the decline in house values nationally from 2009 to 2011, average equity in one’s own home fell 16%. The mean value of rental properties tumbled 32% from 2009 to 2011, and the value of “other real estate equity” (vacation homes and other real estate) declined 2%. Most households (70%) own an interest-bearing account at a bank or other financial institution, such as a certificate of deposit, savings account or money market deposit account. The average value of these accounts fell 19% from 2009 ($27,275) to 2011 ($22,170).
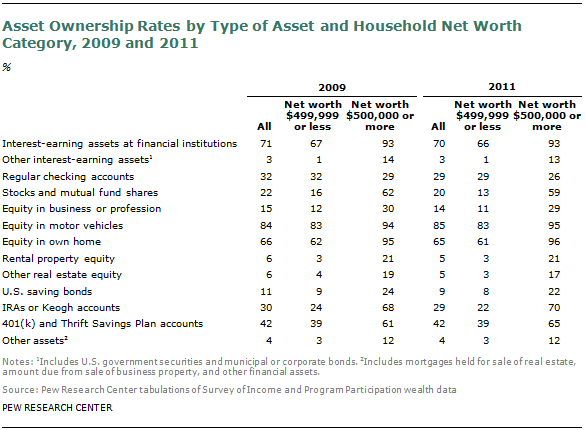
Turning to asset ownership rates, households with a net worth of at least $500,000 were much more likely to own the financial asset categories that experienced large gains in average value. In 2011, households with a net worth of at least $500,000 were about 13 times as likely as households with less than $500,000 in net worth to directly own government securities and municipal and corporate bonds: 13% for high net worth households versus 1% for lower net worth households. Differences in the likelihood of ownership were also pronounced for other high-performing financial asset categories. For example, 59% of households with a net worth of at least $500,000 directly own stocks or mutual fund shares. By comparison, only 13% of lower net worth households directly own these assets. Almost two-thirds of households with at least $500,000 of net worth owned a 401(k) or Thrift Savings Plan retirement account in 2011. Among households with less than $500,000 in net worth, only 39% owned one of these assets.
In the aggregate, all of the total $5.0 trillion increase in household wealth from 2009 to 2011 was the result of increases in various types of financial assets. These gains were heavily concentrated among the affluent. For example, the value of wealth in government securities and corporate and municipal bonds rose $2.2 trillion from 2009 ($0.6 trillion) to 2011 ($2.8 trillion). The value of such assets held by households with at least $500,000 in net worth rose $2.2 trillion and hence high net worth households were the sole gainers in that lucrative asset class. The value of directly owned stock and mutual funds rose $1.4 trillion. The value of direct stock holdings owned by high net worth households rose $1.4 trillion. Wealth in 401(k) and Thrift Savings Plan accounts rose $2.2 trillion. The value of such holdings among households with at least $500,000 in net worth rose $2.1 trillion.
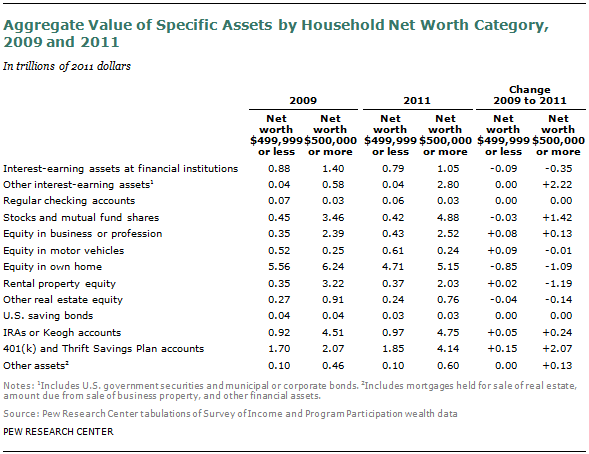
By contrast, the asset classes that experienced declines since 2009 were more widely held and thus the decline in value was not solely concentrated among households with at least $500,000 in net worth. For example, equity in own home tumbled $1.9 trillion from 2009 to 2011, but equity in own home among high net worth households declined only $1.1 trillion.


