Support for the legal right to marry and adopt children is nearly universal within the LGBT population. Still, LGBT adults are less likely than the general public to want to marry or have children. These differences may be related to the fact that marriage—and to some degree, parenting—have been legally off-limits to most LGBT adults.
The survey finds that 16% of LGBT adults—mostly bisexuals in opposite-sex relationships—are currently married, compared with about half of adults in the general public. Overall, a total of 60% of LGBT respondents are either married or would like to marry one day, while 27% say they are not currently sure if they want to marry someday. As for the general public, a similar question on a 2010 Pew Research survey found that 76% of adults were either currently married or thought they wanted to get married, and 13% said they were not sure.21
The new survey also finds that 35% of LGBT adults are parents, compared with 74% of adults in the general public. About half of LGBT respondents (51%) either have children or want to; an additional 19% say they are not sure. A May 2013 Pew Research survey that asked a slightly different question (with no explicit option for “not sure”) found that 91% of all adults either have or want children, with an additional 1% volunteering that they are not sure.
Within the LGBT population, gay men are less likely than lesbians to say they are currently a parent or would like one day to become one. Bisexuals are more likely than gay men and lesbians to already be parents.
LGBT adults are somewhat divided on whether the issue of same-sex marriage should play as prominent a role as an LGBT issue as it has in recent years. Some 58% of survey respondents agree that same-sex marriage should be the top priority right now, but 39% say the issue is taking too much focus away from other important issues, such as equal employment rights.
Views on Same-Sex Marriage
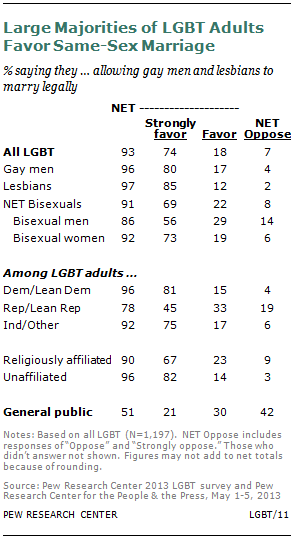
An overwhelming majority of lesbian, gay, bisexual and transgender adults favor allowing gay men and lesbians to marry legally.22 Fully three-quarters (74%) say they strongly favor this, and an additional 18% say they favor same-sex marriage, though not as strongly. Just 7% of LGBT adults say they oppose or strongly oppose same-sex marriage.
Among the general public, support for same-sex marriage has grown markedly over the past decade, but it still falls well below the levels registered within the LGBT population. In a May 2013 Pew Research poll, 51% of Americans said they either strongly favor (21%) or favor (30%) allowing gay men and lesbians to marry legally. About four-in-ten (42%) Americans say they oppose same-sex marriage, with about two-in-ten (19%) saying they strongly oppose it. In 2003, just one-third (32%) of Americans supported same-sex marriage.23
Among LGBT respondents, a greater share of gay men and lesbians than bisexuals strongly favors same-sex marriage. Some 80% of gay men and 85% of lesbians say they are strongly in favor of same-sex marriage, as are 69% of bisexuals. Among bisexuals, women (73%) are more likely than men (56%) to say they strongly favor allowing same-sex couples to marry legally.
There are large differences by age among the general public on the question of same-sex marriage. Americans who are younger than 30 are the most likely to favor same-sex marriage (65% say “strongly favor” or “favor”), and those ages 30 to 49 (54%) are more likely than those ages 50 to 64 (45%) or 65 and older (39%) to favor same-sex marriage. By contrast, among LGBT respondents, at least nine-in-ten in all age groups favor allowing same-sex marriage, though a slightly larger share of LGBT adults ages 18 to 29 than those ages 30 and older say they strongly favor same-sex marriage (82% vs. 71%).
While a majority of all demographic subgroups within the LGBT population favor allowing same-sex marriage, the party and religious divisions on this issue that are evident among the general public are also present to some extent among LGBT adults.
For example, while 81% of LGBT adults who identify with or lean toward the Democratic Party say they strongly favor same-sex marriage, only 45% of LGBT adults who identify with or lean toward the Republican Party say the same. Still, most LGBT Republicans favor allowing same-sex marriage; in all, 78% of LGBT Republicans and 96% of LGBT Democrats either strongly favor or favor same-sex marriage. And compared with Republicans overall, LGBT Republicans are far more accepting of same-sex marriage; only 34% of adults in the general public who identify with or lean toward the Republican Party favor allowing gay men and lesbians to marry legally, with 10% saying they strongly favor this.24
Religiously affiliated LGBT adults are somewhat less supportive of same-sex marriage than those who are religiously unaffiliated. About two-thirds (67%) of the religiously affiliated say they strongly favor same-sex marriage, compared with 82% of those who are atheist, agnostic or have no particular religion. In all, 90% of religiously affiliated LGBT adults either strongly favor or favor same-sex marriage, while 96% of LGBT adults who are not affiliated with a faith favor it. Among religiously affiliated adults in the general public, 47% say they favor same-sex marriage, with just 17% saying they strongly favor it.25
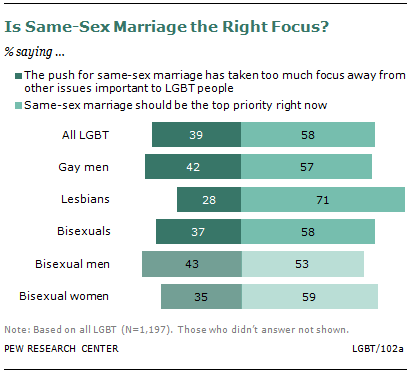
Even with such strong support for same-sex marriage, not everyone in the LGBT population places the issue at the top of the community’s policy agenda. Respondents were asked which statement came closer to their views: “The push for same-sex marriage has taken too much focus away from other issues important to LGBT people” or “Same-sex marriage should be the top priority for LGBT people right now, even if this means some other issues do not get much attention.” Overall, about four-in-ten survey respondents (39%) say the push for same-sex marriage has taken too much focus away from other important issues, while 58% say that same-sex marriage should be the top priority for LGBT people right now.
Among LGBT adults, lesbians (71%) are the most likely to say that same-sex marriage should be the top priority right now. About six-in-ten bisexuals (58%) and gay men (57%) say the same.
Reasons for Getting Married
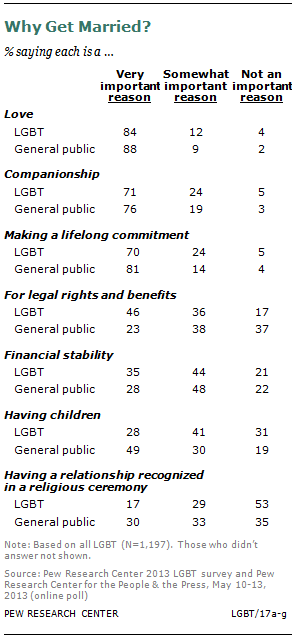
Despite the differences between LGBT adults and the general public on the issue of same-sex marriage, both groups have similar views about the most important reasons to marry. Nearly identical shares of LGBT adults (84%) and all adults (88%) say love is a very important reason to marry, and for each group love ranks at the top of the list of seven possible reasons.
“Companionship” and “making a lifelong commitment” rank second and third for both LGBT adults and the general public. Fully 71% of LGBT adults and 76% of the general public say companionship is a very important reason to get married. When it comes to making a lifelong commitment, LGBT adults are somewhat less likely than all adults to say this is a very important reason to marry (70% vs. 81%).
A greater share of LGBT adults than the general public say that the “legal rights and benefits” of marriage (46% vs. 23%) and “financial stability” (35% vs. 28%) are very important reasons to get married.
Meanwhile, the general public is much more likely than LGBT respondents to say “having children” (49% vs. 28%) and “having a relationship recognized in a religious ceremony” (30% vs. 17%) are very important reasons to get married. Overall, about half of LGBT respondents (53%) say that having a relationship recognized in a religious ceremony is “not an important reason” to get married, compared with about one-third of the general public (35%).
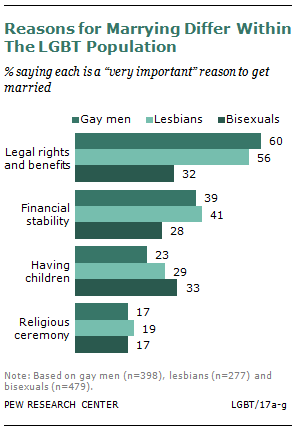
On some of these response categories, bisexuals have attitudes that distinguish them from other LGBT subgroups.
For example, while 60% of gay men and 56% of lesbians say legal rights and benefits are a very important reason to get married, only about half as many bisexuals (32%) say the same. And bisexuals (33%) are somewhat more likely than gay men (23%) to say having children is a very important reason to get married; 29% of lesbians say this.
When it comes to recognition of a marriage in a religious ceremony, the views of bisexuals are closer to those of gay men and lesbians than they are to the general public. About two-in-ten gay men (17%), lesbians (19%) and bisexuals (17%) say this is a very important reason to get married, compared with 30% of all adults.
Marital and Relationship Status
Some 16% of LGBT respondents in the Pew Research survey say that they are currently legally married and an additional 21% say they are living with a partner.26 By comparison, a May 2013 Pew Research survey of the general public found that about half (51%) of all adults say they are married and an additional 7% say they are living with a partner.27
Among the two-in-ten LGBT adults who are living with a partner but not legally married, 7% say they have a legal civil union or domestic partnership and 14% say they are living with a partner outside of a civil union or marriage. An additional 16% of LGBT adults are in a committed relationship, but not living together. About half of LGBT respondents (46%) say they are not currently in any of these types of relationships. Among the general public, about three-in-ten adults are not currently in any of these types of relationships.
Both lesbians and bisexual women are more likely than gay and bisexual men to be in committed relationships. Among LGBT respondents who say they are in some type of committed relationship, almost all gay men and lesbians have same-sex partners, while the overwhelming majority of bisexuals have opposite-sex partners.28
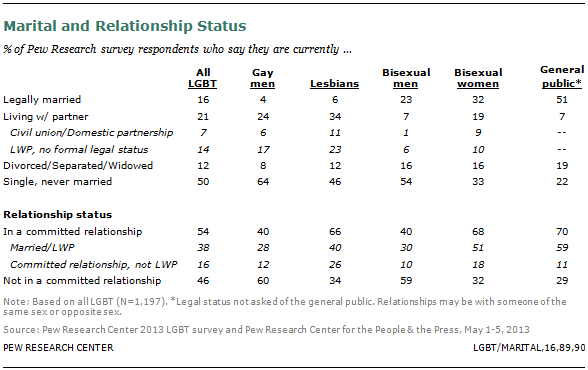
In all, 23% of LGBT adults say they are either legally married or have a legal civil union or domestic partnership; about two-in-ten lesbians (18%) and one-in-ten gay men (11%) have these types of relationships. Bisexuals are the most likely to say they have these types of relationships, particularly bisexual women. Of the 41% of bisexual women and 24% of bisexual men who are married or in a legal union or partnership, most have an opposite-sex partner.
Desire for Marriage
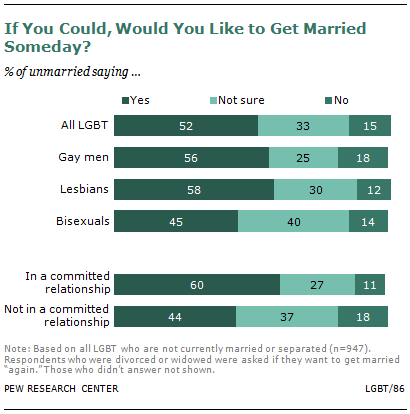
The Pew Research survey asked LGBT respondents who were not currently married or separated if they would like to get married (or get married again) someday. About half (52%) say that they would like to get married in the future, a third (33%) say they are not sure whether they would like to get married someday, and 15% say they do not want to get married. Roughly half of unmarried gay men (56%) and lesbians (58%) say they want to get married someday, compared with 45% of bisexuals.
In all, 60% of LGBT respondents either are currently married or would like to get married.29 An additional 27% are not currently sure if they want to marry someday. The share of LGBT adults who either are married or want to get married is similar across gay men, lesbians and bisexuals; bisexuals are more likely than gay men and lesbians to already be married.
A similar question on a 2010 Pew Research survey found that 76% of adults in the general public were either currently married or thought they wanted to get married, and 13% said they were not sure.30
Views on Same-Sex Adoption
Attitudes about allowing gay men and lesbians to adopt children are nearly identical to attitudes about allowing gay men and lesbians to marry legally.31
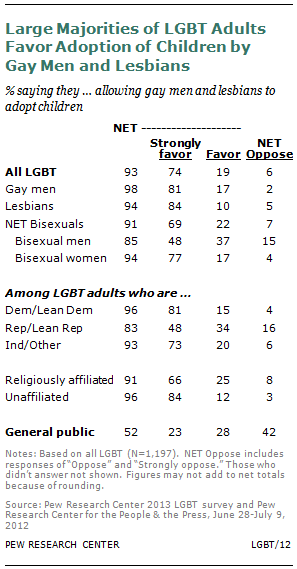
Three-quarters of LGBT adults (74%) say they “strongly favor” allowing gay men and lesbians to adopt children. An additional two-in-ten (19%) say they favor adoption among gay men and lesbians, though not as strongly. Just 6% of LGBT adults say they oppose or strongly oppose allowing gay men and lesbians to adopt children.
The general public’s views on allowing gay men and lesbians to adopt children also parallel their views on same-sex marriage. In a June 2012 Pew Research poll, 52% of Americans said they either strongly favor (23%) or favor (28%) allowing gay men and lesbians to adopt children. About four-in-ten (42%) Americans said they oppose adoption by gay men and lesbians, with about two-in-ten (22%) saying they strongly oppose it.
Just as public support for same-sex marriage has increased over the past 10 to 15 years, so has support for adoption by gay men and lesbians. In 1999, the balance of opinion was reversed: 42% of Americans favored allowing gay men and lesbians to adopt children and 52% opposed it.32
Among LGBT respondents, a greater share of gay men and lesbians than bisexuals says they strongly favor allowing gay men and lesbians to adopt. Some 81% of gay men and 84% of lesbians say they are strongly in favor of adoption by gay men and lesbians, compared with 69% of bisexuals. Bisexual women (77%) are more likely than bisexual men (48%) to say they strongly favor allowing adoption.
Among LGBT adults, those younger than 30 are more likely than those ages 30 and older to be strongly in favor of allowing gay men and lesbians to adopt (85% vs. 70%), but at least nine-in-ten of both younger and older LGBT adults say they either strongly favor or favor this (96% and 92%, respectively).
There are large age gaps on this issue among the general public as well. Adults younger than 30 are the most likely to say they strongly favor or favor allowing gay men and lesbians to adopt children (67%), followed by those ages 30 to 49 (56%) and ages 50 to 64 (47%). Just one-third (35%) of those ages 65 and older favor allowing gay men and lesbians to adopt.33
The patterns by party and religious affiliation are almost identical for the issue of adoption by gay men and lesbians as they are for the issue of same-sex marriage.
LGBT Parents
About one-third (35%) of LGBT respondents in the Pew Research survey are parents, and 17% have children who are younger than 18. Bisexuals are the most likely to be parents about half (52%) of bisexuals are parents, including 59% of bisexual women and 32% of bisexual men. Three-in-ten (31%) lesbians and 16% of gay men are parents.
Three-in-ten (30%) bisexuals have children younger than 18, and the gap between bisexual women (40%) and bisexual men (4%) is wide. By contrast, only 8% of lesbians and 5% of gay men have children under age 18.
The shares of parents with children of any age and parents with children younger than 18 among adults in the general public are about twice as high as they are among LGBT adults. About three-quarters of adults in the general public (74%) are parents, and about one-third (32%) have children younger than 18 currently living in their household.34
The Pew Research survey asked LGBT respondents younger than 60 who were not already parents if they would like to have children someday or not. About three-in-ten (28%) of these LGBT respondents say they would like to have children someday, 34% say they are not sure, and 36% say they would not like to have children.
Overall, 51% of LGBT adults of all ages either have children already or would like to have children someday. An additional 19% say they are currently not sure. A May 2013 Pew Research survey of the general public included a slightly different question (with no explicit option for “not sure”) and found that nearly all adults in the general public either already have children or would like to have children someday (91%).35 Though the questions on the LGBT and general public surveys were not identical, this nevertheless suggests lower levels of interest in parenthood among LGBT adults than among the general public.36


