As college costs have increased in recent decades, so, too, have many of the economic rewards for getting a four-year degree as well as the penalties for not doing so, according to a new Pew Research Center analysis of U.S. Census Bureau data.
The analysis, which focuses on young adults in the first phase of their working lives, finds that the earnings gap by education level among 25- to 32-year-olds has widened significantly over the past half century. Those with a bachelor’s degree or higher are earning more in inflation-adjusted dollars than their similarly educated counterparts from prior generations did at the same age, while those with a high school diploma or some college are earning less.
As a result of these shifts, young adults today have more unequal earnings between education levels than their same-aged peers did in earlier times—mirroring the broader increase in income inequality that has become one of the defining features of American life. This Pew Research analysis focuses primarily on earnings, but it also tracks other key measures of economic well-being, including employment characteristics, unemployment rates, duration of unemployment, poverty, wealth, personal income and household income. With some minor variations, the overall story is the same across all of these measures: the gap in economic well-being by education level has grown over time.
The analysis produces a mixed picture, however, when it compares the overall economic well-being of all of today’s young adults with that of their same-aged counterparts in earlier times. While today’s young adults are doing better on some measures (earnings, adjusted median household income), they are doing worse on others (unemployment, poverty, wealth and median personal income).
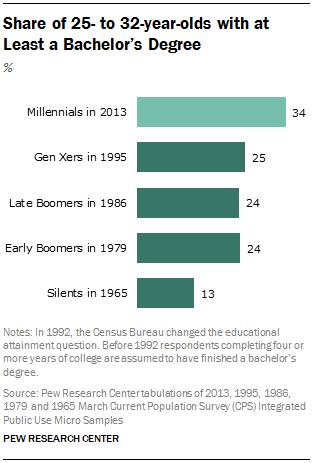
This overall lack of economic progress from one generation of young adults to the next is notable in view of the fact that today’s young adults are the best-educated generation in history: Some 34% of 25- to 32-year-old Millennials have a bachelor’s degree or more, compared with 25% of Gen Xers, 24% of Baby Boomers and 13% of the Silent generation when they were the same age as today’s Millennials.
The remainder of this chapter provides a comprehensive examination of the labor market and economic outcomes associated with attainment of a bachelor’s degree among today’s Millennial adults. First it compares outcomes for Millennials who have at least a bachelor’s degree to those of Millennials with some college education (but not a bachelor’s degree) and Millennials with a high school diploma but no further formal education. It also compares the economic outcomes of today’s young adults with those of earlier generations when they were the same age that Millennials are now.
Definitions and Methods
Throughout the chapter, “young adults” refers to those ages 25 to 32 (inclusive). Unless noted, all figures refer to 25- to 32-year-olds.
Consistent with earlier Pew Research definitions, Millennials were born after 1980. Gen Xers were born from 1965 to 1980, Baby Boomers from 1946 to 1964 and Silents from 1928 to 1945.
Labor market and economic outcomes are examined in 2013, 1995, 1986, 1979 and 1965 (when available). Young adults in 2013 were Millennials. Most young adults in 1995 were Gen Xers. Young adults in 1986, 1979, and 1965 capture late Boomers, early Boomers and the Silents, respectively.
The 2013 data were collected in March of 2013 and (according to the official National Bureau of Economic Research business cycle dating) captures economic outcomes four years into the economic recovery. The Great Recession officially ended in June 2009.
The 1995, 1986, 1979 and 1965 time points are comparable to 2013 in that they also represent a point in time four years into an economic recovery. NBER designates bottoms of economic recessions occurring in March 1991, November 1982, March 1975, and February 1961, respectively.
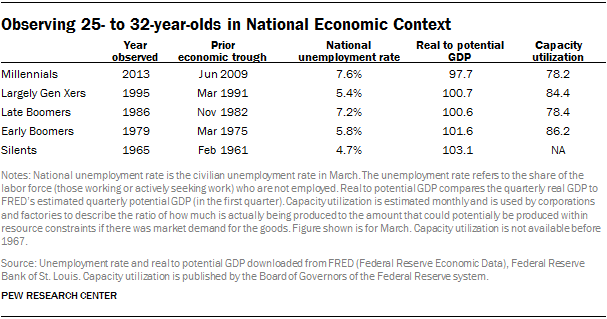
Though the five time points examined mark years that were four years into an economic recovery, national macroeconomic conditions were not identical in the five years. Prominent macroeconomic indicators suggest that the aggregate economy was less vigorous in 2013 than the earlier comparison points.
Common wisdom also suggests 2013 marks a distinct period. After all, the Great Recession is coined the Great Recession.
Though aggregate economic conditions may be weaker in 2013 than earlier years, this does not necessarily imply that Millennials are worse off than earlier generations. That depends on how they are faring in the labor market and their particular circumstances, the subject of this chapter.
College Graduates in the Labor Market
Most young adults have few income sources beyond what they can earn on the job. And a basic motive for pursuing college is to enhance one’s skills and fortunes in the job market. This section focuses on what young workers are paid, the ease of finding work, and some characteristics of their jobs (such as pension coverage and unionization).
On the one hand, it is clear that young, college-educated workers are having more difficulty landing work compared with earlier cohorts of young adults. They are more likely to be unemployed, and it takes them longer, on average, to find a job. On the other hand, once they’re employed, their earnings are higher than those received by earlier cohorts of young, college-educated adults. For less-educated young workers, there is no upside: They are more likely to be unemployed and they are spending more time searching for a job compared with less-educated young workers who came before them. And their earnings are significantly below those received by less-educated young workers in earlier generations (with the exception of high school-educated Gen Xers).
Annual Earnings
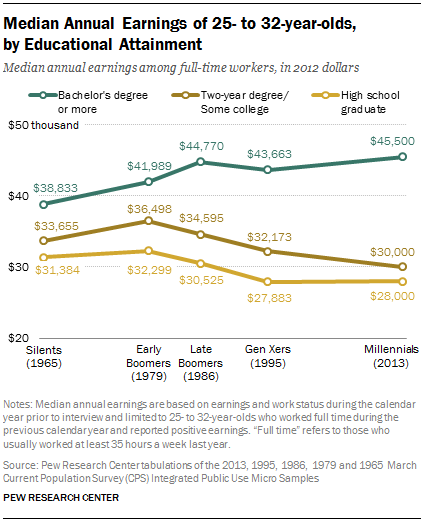
One dimension where Millennial college graduates are faring better than prior generations is in annual earnings. The Census Bureau collects detailed information on earnings and hours worked for the calendar year before the Current Population Survey is collected. Among Millennials who usually worked full time during 2012, the typical college graduate earned about $45,500. This is significantly higher than the earnings of Gen X college graduates in 1995 ($43,663, in 2012 dollars). The earnings of college-educated Millennials also tend to be above their late Boomer ($44,770), early Boomer ($41,989), and Silent generation ($38,883) counterparts.
Earnings for Millennials without a bachelor’s degree are significantly lower than for similarly educated young adults from previous generations. Earnings for young, full-time workers without a bachelor’s degree were at their highest level in the late 1970s. Among young adults in 1979, those with a high school diploma had median annual earnings of $32,299. By comparison, the average Millennial with only a high school education made $28,000 in 2012.
While the earnings of less-educated Millennials are sinking in comparison with earlier less-educated young adults, the earnings of all Millennials have remained relatively flat. In 2013, the earnings of all Millennials employed full time were about $35,000. That compares with about $34,900 for all early Boomers in 1979. Two factors are supporting the earnings of Millennials: College-educated Millennials tend to earn more than college-educated young adults used to, and there has been a compositional shift among this age group. More Millennials are college-educated than was the case for earlier cohorts.
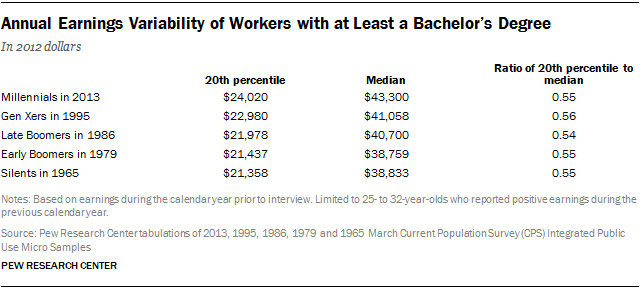
These earnings figures utilize the median earnings of college graduates working full time in the prior year. The median refers to the amount earned by the full-time college graduate in the middle, or earning more than exactly half of full-time college graduates. Although the middle full-time college graduate might be earning more than prior generations, it is possible that earnings outcomes are now more variable and that more Millennials are experiencing low earnings compared to earlier generations. The table below compares the earnings level of the bottom one-fifth of college graduates to that of the median college graduate. The distribution is for all college graduates who had positive earnings, not just those working full time the prior year. At least at the 20th percentile, earnings do not appear to be more variable for Millennials than earlier generations. Some Millennial college graduates did earn low amounts during 2012, but no more so than earlier cohorts.
Unemployment
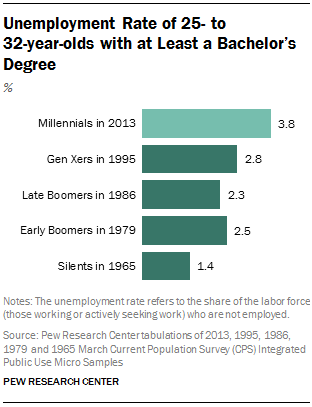
Today’s recent college graduates have had more difficulty finding employment than earlier generations. Among Millennial college graduates, 3.8% were unemployed in 2013.5 By comparison, only 2.5% of early Boomer college graduates were unable to find work in March 1979.
In 2013, better-educated Millennials experienced much lower unemployment rates than their less-educated peers (see chart in Appendix A). For example, 12.2% of Millennials with only a high school education were looking for work in 2013, 8 percentage points higher than the rate among college-educated Millennials.
College-educated young adults in each generation had less difficulty finding work than their less-educated counterparts. In 2013, college-educated Millennials were a third less likely to be unemployed than were Millennials with only a high school education. In 1995, 2.8% of college-educated Gen Xers were unemployed, compared with 6.9% of Gen Xers whose formal education did not go beyond high school. Similarly, back in 1979, college-educated early Baby Boomers were more than half as likely to be unemployed (2.5%) as those with only a high school education (6.1%).
Across generations, those with some college experience (but not a bachelor’s degree) have fared somewhat better than those with no college experience. In 2013, Millennials with a bachelor’s degree were about half as likely to be unemployed as Millennials with some college (3.8% vs. 8.1%). The unemployment differential between Gen Xers with some college (4.7%) and their peers who had finished college (2.8%) was a bit narrower in 1995. The unemployment differential was similar in 1979: 2.5% for early Boomer college graduates vs. 4.7% for early Boomers with some college.
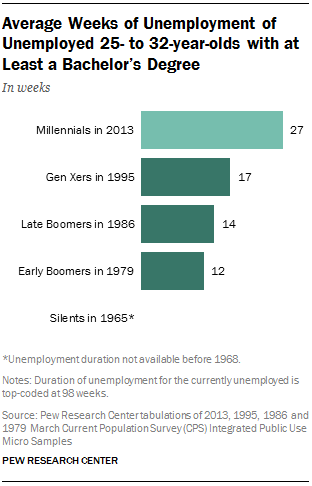
Weeks unemployed. The typical unemployed college-educated Millennial has spent much longer searching for work than earlier generations of college graduates. In 2013, the average unemployed college-educated Millennial had been looking for work for 27 weeks. By comparison, college-educated 25- to 32-year-olds who were unemployed in 1979 spent on average only 12 weeks looking for a job. And in 1995, unemployed Gen Xers with a bachelor’s degree spent on average 17 weeks looking.
Typical unemployed college-educated Millennials have not been looking for work as long as their less-educated counterparts (see chart in Appendix A). In 2013, unemployed Millennials without a college degree had been looking for work on average 31 weeks. And there is some evidence that the advantage that the college-educated have in regard to shorter unemployment length may have widened over time. In 1979 there was little difference in the average length of unemployment between college graduates and less-educated young adults.
Hours of Work
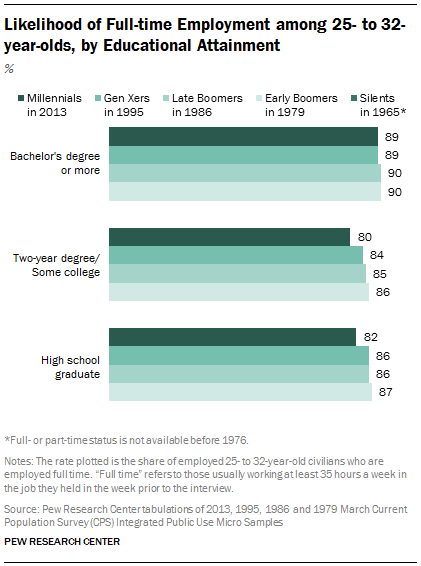
Full-time employment. College-educated Millennials are no less likely than earlier generations of young adults to land full-time work. In 2013, 89% of employed college-educated Millennials worked full time (usually working at least 35 hours per week in the job they held in the week prior to the interview). This is only slightly below the share of young-adult college graduates who were employed full time in 1979 (90%).
Less-educated Millennials were significantly less likely than their college-educated peers to land full-time work in 2013. For example, only 82% of high school-educated Millennials with jobs worked full time.
The disparity in working full time between the more-educated and less-educated has widened over time. For example, among young adults in 1979, college graduates were only slightly more likely than those with a high school education to be working full time (90% vs. 87%). In 2013, the disparity between college graduates (89%) and those with a high school education (82%) had widened to 7 percentage points.
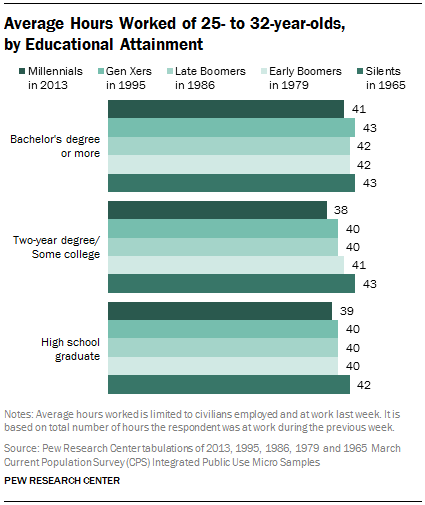
Average hours worked. The length of the average workweek has declined somewhat among college-educated young adults. In 2013, college-educated Millennials worked on average 41 hours per week. In 1965, college-educated young adults (members of the Silent generation) worked an average of 43 hours a week.
However, college-educated Millennials tend to have longer workweeks than their less-educated counterparts. In 2013, the average Millennial with some college education worked 38 hours (compared with 41 for the average college graduate).
Job Characteristics
Though complete information is not available on the earlier cohorts of young adults, the Census Bureau has queried respondents on several employment dimensions.
Union coverage. Some 14% of college-educated Millennials were employed in a unionized workplace in 2013. Among Gen X college graduates in 1995, a similar share (13%) worked in unionized settings. An educational gap in union coverage is apparent among Millennials in 2013. Among Gen Xers in 1995, those with no formal education beyond high school were slightly more likely than college graduates to have a unionized employer. However, in 2013, Millennials with a high school education (6%) are substantially less likely than college-educated Millennials (14%) to be employed in a unionized setting.
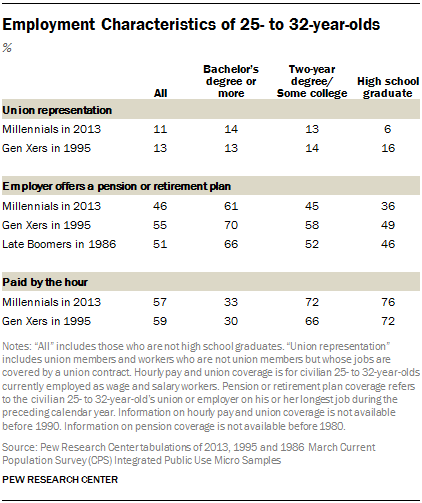
Retirement plan or pension coverage. Fewer college-educated Millennials worked for employers offering a pension or other retirement plan (other than Social Security, i.e., defined contribution plans) compared with earlier generations. In 2013, 61% of college-educated Millennials worked for an employer with a retirement plan. By comparison, 66% of college-educated late Baby Boomers had pension coverage in 1986; the share rose to 70% for college-educated Gen Xers in 1995. However, pension coverage has declined for all young adults, and the decline has been more pronounced among the less-educated than for the college-educated. For example, only 36% of high school-educated Millennials labored for an employer with a pension plan in 2013, a decline of 11 percentage points from the incidence of pension coverage among high school-educated late Baby Boomers in 1986 and a decline of 13 points from the high school-educated Gen Xers in 1995.
Monetary Terms
The analysis presents several monetary measures to assess young adult outcomes:
Earnings of full-time workers: the young adult’s pretax wage and salary income received during the previous calendar year. It does not include the value of fringe benefits. It is reported for employees who usually worked at least 35 hours a week during the prior calendar year.
Household income: the sum of the total income during the previous calendar year of all household members ages 15 and older. It includes wage and salary income, rents, dividends and interest income, as well as cash income transfers. The specific measure presented performs the common adjustment of adjusting for the number of persons in the household.
Personal income: the total income of the young adult during the previous calendar year. It includes wage and salary income, rents, dividends and interest income, as well as cash income transfers.
Household wealth: the value of the assets of all household members (in households headed by a young adult) minus the value of all liabilities of all household members (in households headed by a young adult).
All dollar figures are adjusted for inflation and expressed in 2012 dollars.
Hourly pay. In March 2013, one-third of college-educated Millennial workers were paid by the hour. By comparison, 30% of Gen X college graduates were paid by the hour in 1995, when they were a comparable age. Among young adults, those with some college or only a high school education were much more likely than their college-educated counterparts to be hourly workers, and the increased incidence of hourly pay among Millennial workers compared with Gen X workers was at least as great among the less-educated as among the college-educated.
The Broader Economic Arrangements of College Graduates
This section examines the larger economic context of young adults by education. These outcomes reflect more than just someone’s success in the labor market. Well-being reflects the young adult’s household arrangements and thus depends on the size of the person’s household, whether the person has a spouse or unmarried partner, as well as whether there are children present and parental decisions on how much to work.
The measures together present a mixed picture. Considering the outcomes in absolute fashion, college-educated young adults today are faring better than earlier generations on some measures, and worse on others. But consistently, the gaps in outcomes between the college-educated and their less-educated counterparts have grown. Since the 1970s, education increasingly tends to demarcate the more economically successful from the less economically successful.
Household Income
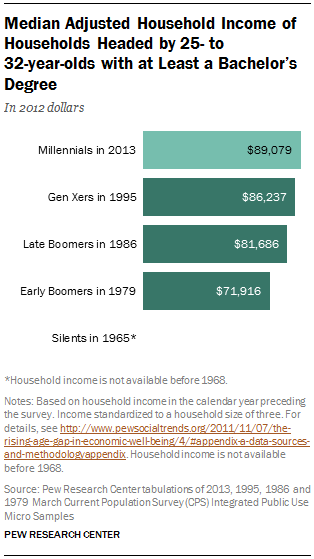
The incomes of households headed by college-educated 25- to 32-year-olds have markedly increased since the 1970s. The median (size-adjusted) income of households headed by a college-educated Millennial was $89,079 in 2013.6 By contrast, the median income of households headed by a college-educated young adult in 1979 was only $71,916.7
At least three factors likely contribute to the rising household incomes of the young and college-educated. First, as shown in the last section, the earnings of college graduates have been increasing, and that directly contributes to rising household income. Second, as young adults increasingly delay marriage and childbearing, it follows that college-educated households headed by Millennials likely have fewer children than college-educated households in earlier generations. Since size-adjusted household income takes account of household size, Millennials’ smaller households will be reflected in a boost to this measure of household income. Third, with fewer children in the household, less time can be devoted by the parent(s) to child care and more time can be devoted to market work, again indirectly boosting household income.8
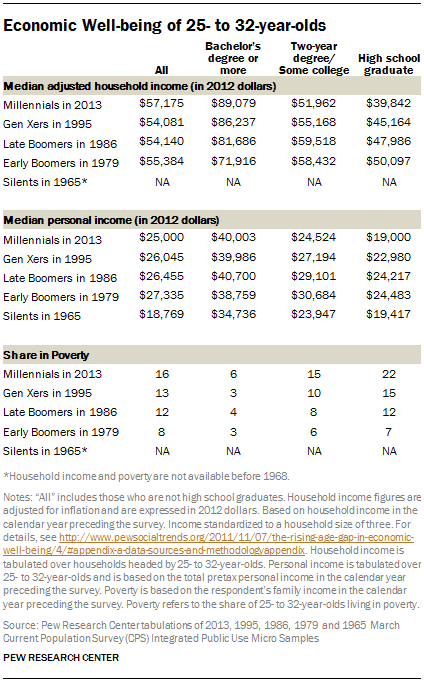
The household incomes of young adults with less education tend to be substantially lower than their college-educated counterparts, and they have been falling since the 1980s. For example, the median income of households headed by a Millennial with a high school education was $39,842 in 2013, about $50,000 below that of college-educated counterparts ($89,079). And the gap in the typical household income of young household heads with and without a college degree has increased substantially over time. In 1979, college-educated young adults had household incomes about $22,000 above those of households headed by young adults with only a high school education. That gap has widened to $50,000 among Millennials.
For details on median personal income, see Appendix C.
Poverty and Wealth
Though household income figures indicate that the typical college-educated Millennial household is better off than in previous generations, poverty figures indicate that a segment of the college-educated are faring worse. In 2013, 6% of college-educated 25- to 32-year-olds were living in poverty, double the poverty rate of college-educated young adults in 1979 (3%).9
Poverty has been on the rise among all young adults, and the increase has been greatest among lesser educated 25- to 32-year-olds. Poverty has tripled among 25- to 32-year-olds with only a high school education. In 1979, 7% of young adults with only a high school education were living below the poverty line. Among high school-educated Millennials in 2013, fully 22% were poor.
Another common measure of economic well-being is wealth or net worth. Income and poverty are based on the resources obtained by the household over the prior calendar year. Wealth is the household’s nest egg or what it has been able to save out of income over the years. Wealth is what the household has or the value of what it owns (assets) minus what it owes (debts). Wealth is advantageous for a number of reasons, including that it is a storehouse of value that can be accessed during spells of unemployment and other adverse events.
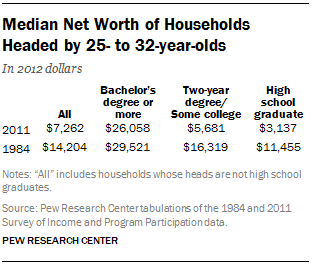
The Census Bureau measures income and poverty every year, but it captures household wealth less regularly. In 2011, the wealth of the typical household headed by a 25- to 32-year-old with at least a bachelor’s degree was $26,058.10 In 1984, the median wealth of households headed by a 25- to 32-year-old with a bachelor’s degree was $29,521, so typical wealth levels have declined 12% for the young and college-educated. Declines in wealth have been even greater for less-educated households. In 2011, the median wealth level of households headed by a 25- to 32-year-old with a high school education was $3,137. This represents a 73% decline in the typical wealth of similar households in 1984 ($11,455).
Living Arrangements
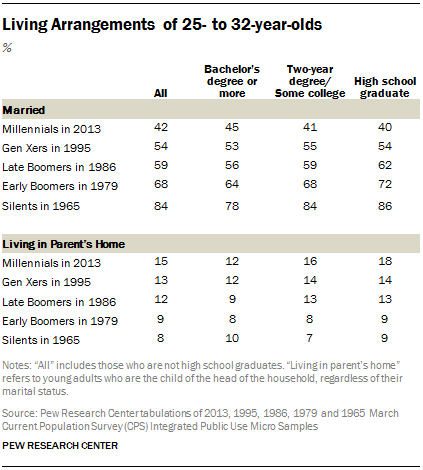
Are Millennials earning enough to live independently? The answer depends on which Millennials you focus on. For young adults without a bachelor’s degree, the passage to financial independence may be taking longer. But college graduates are not substantially delaying their departure from the parental nest, a reflection in part of their superior fortunes in the labor market.11
College-educated Millennials are much less likely to be married than their counterparts in earlier generations. In 1965, of college-educated young adults (members of the Silent generation), nearly eight-in-ten (78%) were married. In 2013, less than half of college-educated Millennials (45%) were married. The decline in marriage among 25- to 32-year-olds has been even greater among less-educated young adults. In 1965, 86% of high school-educated Silents were married. In 2013, only 40% of their Millennial counterparts were married.
The decline in marriage among the young and college-educated does not imply that college-educated Millennials are not forming their own households and living independently of their parents. Though college-educated Millennials may not have a spouse, many of them have unmarried partners.12
Some 12% of college-educated 25- to 32-year-old Millennials were living in a parent’s home in 2013. By comparison, 10% of college-educated young adults lived with their parent(s) in 1965. So the tendency to live at home has increased among the college-educated, but it seems to be a measured increase among young adults with at least a bachelor’s degree. By contrast, the likelihood of living at home has markedly increased among less-educated young adults. For example, 9% of Silents with a high school education lived at home in 1965. In 2013, 18% of high school-educated Millennials were living at home, twice the rate of Silents.


