About half of today’s 25- to 34-year-olds (49%) have never been married, a fourfold increase since 1960 (12%). The median age at first marriage is now 27 for women and 29 for men, up from 20 for women and 23 for men in 1960.18
Young adults are not opposed to marriage, however. According to the new Pew Research survey, only 4% of never-married adults ages 25 to 34 say they don’t want to get married. A majority of them either want to marry (61%) or are not sure (34%).

Compared with older adults who have never been married (those ages 35 and older), young adults are more likely to cite financial insecurity as the main reason they are not currently married (34% vs. 20%). An additional 29% of young never-married adults say that they haven’t found someone who has what they are looking for in a spouse. Only 13% say they are too young or are not ready to settle down.
Given the median age at first marriage, young adults ages 25 to 34 are arguably the prime age group on the marriage market today. This chapter looks at never-married young adults—analyzing the male-to-female ratio among this age group as well as the ratio of employed men to women. Of course, never-married young adults could marry someone in a different age group or someone who has previously been married. These ratios aim to illustrate only how the marriage market for young adults has changed since 1960.19
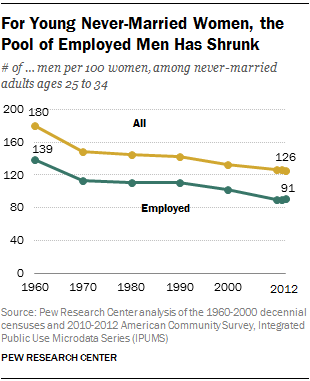
At first glance, never-married young men outnumber never-married young women on the marriage market. In 2012, there were 126 never-married men ages 25 to 34 for every 100 never-married women in that age group. The number has gone down from 180 in 1960, but it is still well above 100.
The ratio of employed men to all women among never-married young adults is much lower than the overall male-to-female ratio. It has also dropped over time – from 139 employed men per 100 women in 1960 to 91 in 2012.20
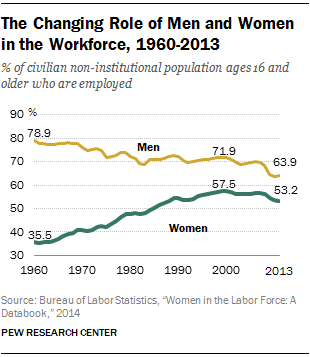
Part of this change can be attributed to overall trends in the employment status of men and women. The share of men ages 16 and older who were employed was nearly 80% in 1960 and had dropped to 64% by 2013. By contrast, the employment rate among women has risen steadily, from 36% in 1960 to a peak of 57% in 2000 and ending up at 53% in 2013.
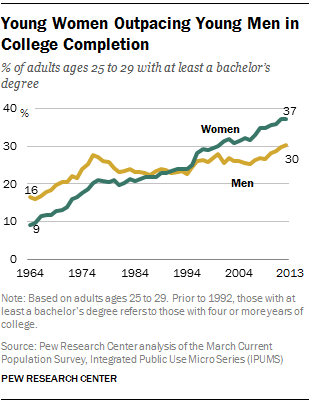
Meanwhile, young women are more likely than young men to graduate from college nowadays. Since the 1990s, women have outnumbered men in both college enrollment and college completion rates, reversing a trend that lasted through the 1960s and ’70s. By 2013, 37% of women ages 25 to 29 had at least a bachelor’s degree, compared with 30% of men in the same age range.
Women are also more likely to continue their education after college: 12% of women ages 25 to 34 in 2013 had a master’s, doctorate or professional degree, compared with 8% of their male counterparts.
The marriage market that young adults face today reflects changes in women’s educational attainment and employment status relative to men. People tend to marry people whose education level is similar to their own, and the degree of “educational assortative mating” has increased in the past few decades, especially among adults who have a college degree.
Among never-married young adults who have a post-graduate education, there are 77 men for every 100 women, and among those who have a college degree, the ratio is 102 men for every 100 women. These sex ratios are significantly different from the ratios among never-married young adults with a high school education or less, where men outnumber women by a significant margin (174 men for every 100 women).
When men’s employment status is taken into account, the number of never-married young men per 100 women drops at every education level. The falloff is greatest among young men with a high school education or less. Within this educational cohort there are 174 men, but only 108 employed men, for every 100 women.
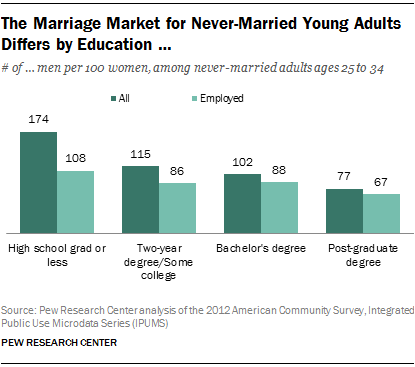
The pool of employed men is relatively small for never-married young women with college degrees as well. For every 100 college-educated never-married young women, there are only 88 employed college-educated young men. The ratio is even more skewed for never-married young women with a post-graduate education: There are only 67 employed young men per 100 women in this education group. This may shed light on a rising share of women marrying men who are less educated than they are.
Another factor that relates to the marriage market is race or ethnicity. It is true that interracial and interethnic marriages are on the rise in the U.S., and the new Pew Research survey finds that among unmarried adults, a similar racial or ethnic background is viewed as a less important criterion for a potential spouse than finding someone with a steady job or someone with shared views about child rearing. Even so, 85% of new marriages still take place between adults whose racial or ethnic backgrounds are similar.
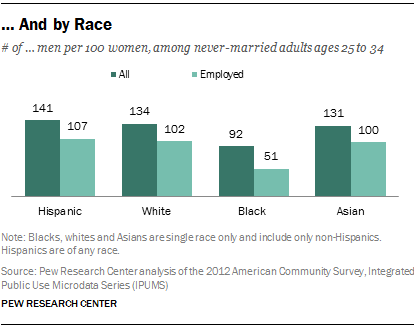
Never-married young men outnumber never-married women in most racial and ethnic groups except for blacks. Among never-married African Americans ages 25 to 34, there are 92 men for every 100 women. The number of never-married young men per 100 women is 141 among Hispanics, 134 among whites and 131 among Asians.
After factoring in the employment status of men, the pool of never-married young men shrinks significantly, especially for never-married black women. There are 51 never-married employed young black men for every 100 never-married young black women. The ratio is roughly even—100 men for every 100 women among Hispanic, white and Asian never-married young adults.
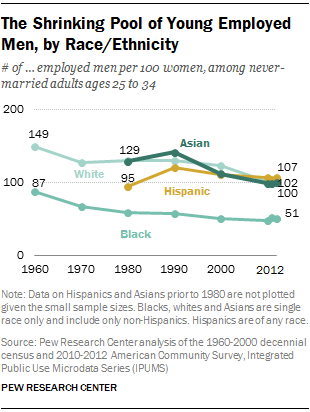
The pool of young employed men was much larger for both white and black never-married young adults in 1960, when there were 149 employed young white men for every 100 young white women, and 87 employed young black men for every 100 black women.
Among never-married Hispanic and Asian young adults, the number of employed men per 100 women has fluctuated over time but has gone down significantly in the past two decades. The number of employed men per 100 women went down from 141 in 1990 to 100 in 2012 for Asians and from 121 to 107 for Hispanics.


