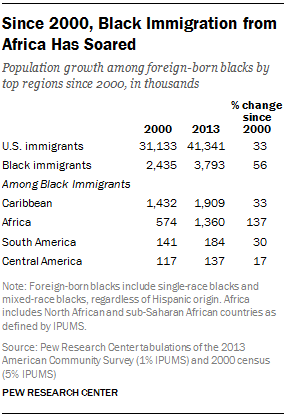
Since 2000, the foreign-born black population has grown from 2.4 million to 3.8 million, an increase of 56%. Among this population, the number of black African immigrants grew most—by 137% between 2000 and 2013. By comparison, the black Caribbean immigrant population rose by a third during this period, while the number of black South American and black Central American immigrants increased by 30% and 17%, respectively.
Moreover, the share of black immigrants from Africa now stands at 36%, up from 24% in 2000; by comparison, the percentage of black immigrants from the Caribbean dropped from 59% to 50%.
Besides population size, some characteristics of the black immigrant population have changed since 2000.
Citizenship rates for foreign-born blacks have increased by 10 percentage points since 2000, rising from 44% with citizenship to 54% over the period. The share of black African immigrants who are U.S. citizens rose dramatically; in 2000, only 29% were U.S. citizens, by 2013, that figure had risen to 47%. The lower shares of black African immigrants who were U.S. citizens in 2000 may be due to the fact that legal permanent residents are generally required to wait five years before taking the U.S. citizenship test. And in the late 2000’s, the share of African immigrants who were legal permanent residents was estimated at 26%.16 Among other black immigrants, citizenship rates rose 10 percentage points for those from the Caribbean and seven points for South Americans, while it dropped two points among Central Americans.
Foreign-born blacks also are a somewhat older population today than in 2000 when the median age was 37; today it is 42. Among the foreign-born black population, South Americans and those from the Caribbean had the biggest changes in median ages; their population aged six and eight years, respectively. The populations of black African immigrants and black Central American immigrants are only slightly older than their counterparts in 2000.
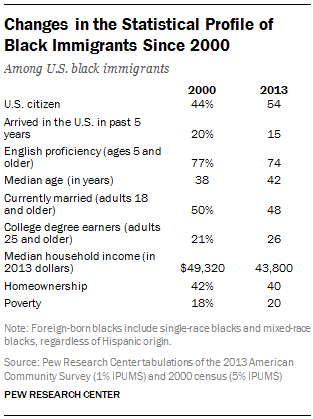
The share of black immigrants ages 5 and older who were proficient English-language speakers was 74% in 2013; in 2000, that share was 77%. Also, in 2000, nearly half (49%) of black immigrants 5 and older lived in English-only households; that share dropped to 43% in 2013. The major black immigrant group with the largest drop was South Americans; 75% of those ages 5 and older lived in English-only homes in 2000, compared with 66% in 2013.
Compared with 2000, black immigrants ages 25 and older today are more likely to have a bachelor’s or advanced degree; the share has grown from 21% then to 26% in 2013. The share with a bachelor’s degree or more grew 5 percentage points for black immigrants from South America, from 20% in 2000 to 25% in 2013. The share of black Caribbean immigrants with a college degree also increased over the period, from 16% to 20%. Black African immigrants were the only group whose educational attainment declined, falling slightly from 38% to 35%, in the share with a college degree during this time.
The median annual household income for black immigrants in 2000 was $49,320 (in constant 2013 dollars) compared to $43,800 today. This overall decline is on a par with the U.S. population overall.
But there were some areas with little change. Half of foreign-born black adults in 2000 were married; today that share is only 2 percentage points lower, 48%. Additionally, the percentage of foreign-born blacks who are homeowners (42%) is about the same as it was in 2000. The share of black immigrants living below the poverty line has risen slightly since 2000, from 18% in 2000 to 20% in 2013. These changes varied little by region of birth.


