Despite significant growth over recent decades, multiracial Americans currently make up a relatively small share of the general public. But a new Pew Research Center survey finds that the mixed-race adult population could be as much as three times what current government estimates suggest.
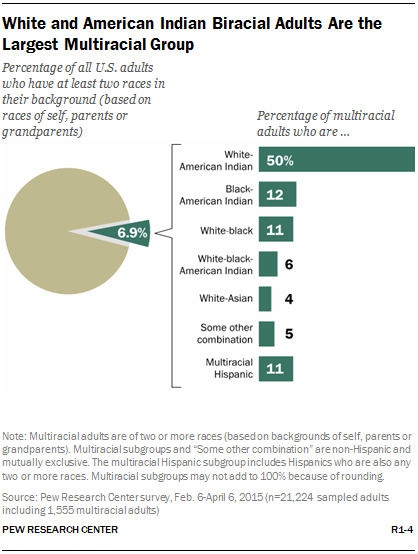
Using a different method than the U.S. Census Bureau, taking into account the races reported by adults, along with the races they report for their parents and grandparents, the Pew Research survey finds that 6.9% of Americans 18 or older have a multiracial background. That compares with the 2.1% of adult Americans who said they were two or more races in the Census Bureau’s 2013 American Community Survey.
The Pew Research survey also finds that biracial adults with a white and American Indian background comprise half of the country’s multiracial population.38 Black and American Indian biracial adults account for an additional 12%, while those with a white and black background make up 11%. Those with white, black and American Indian in their racial background make up 6% of the total mixed-race population, and white and Asian biracial adults account for an additional 4%.
One-in-ten mixed-race adults (11%) are Hispanic and two other races, and the remaining shares are scattered across the 16 other combinations of non-Hispanic multiracial backgrounds represented in a nationally representative sample of 21,224 adults, including 1,555 multiracial Americans.
Determining Multiracial Background
To estimate the share of Americans who are multiracial, Pew Research Center researchers used a new approach to measure an individual’s racial background. In addition to asking individuals their race or races, the questionnaire asked a series of follow-up questions about the racial backgrounds of respondents’ biological parents, grandparents and earlier ancestors.
The series began with a version of a question asked by the U.S. Census Bureau in 2010 to test alternate ways of measuring racial background. It asked respondents, “What is your race or origin?” and allowed them to choose as many categories as they wished. Hispanic origin was included in the list, which otherwise consisted of racial categories. (See Appendix A for a complete description of the methodology used in the survey.)
Overall 1.4% of the 21,224 study participants reported they were two or more races in response to the initial question asking about their racial background. This estimate, based on the initial question is comparable to the 2.1% estimate for adults from the Census Bureau’s 2013 American Community Survey, the latest data available.
The Census Bureau’s figure may be higher in part because it considers people to be multiracial if they give a single race along with “some other race”—many of which were write-in Hispanic origins, such as “Mexican.” For Hispanics to be counted as mixed race in the Pew Research estimate, they had to choose Hispanic plus two other races (not including “some other race”) for themselves, their parents or their grandparents. (See Chapter 7 for a more detailed discussion of multiracial Hispanics, including an expanded estimate of the multiracial population that includes those who are Hispanic and one race but also consider their Hispanicity to be part of their racial background.)
Respondents were then asked about the racial background of their biological mother and father. Adults who said that at least one of their parents was a different race from them or was more than one race were classified as having a mixed racial background. And when they were added to the initial 1.4% who said they themselves were more than one race, the share of multiracial Americans increased to 4.3% of all adults. When the backgrounds of respondents’ biological grandparents were factored in, the share rose to 6.9%.
When the racial backgrounds of great-grandparents and earlier biological ancestors were considered, the proportion of adults who could be considered multiracial nearly doubled to 13.1%. However, those who choose a single race for themselves, their parents and their grandparents but say they had a more distant relative of a different race are not included in the analysis of the Pew Research survey results. About nine-in-ten of this group (87%) do not identify as mixed race or multiracial when asked, “Do you consider yourself to be mixed race or multiracial, that is more than one race, or not?”39 The survey findings also suggest that a significant share in this group do not consider themselves multiracial because they have never met their relative who was of a different race.
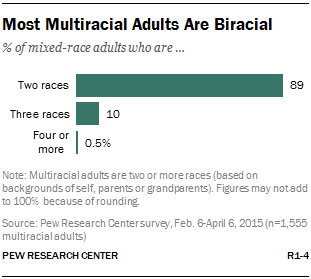
The survey also finds that about nine-in-ten multiracial adults (89%) are biracial. An additional 10% have three races in their background, while 0.5% have four or more.
My racial background is very important to my overall identity. … There’s not a day that goes by that I’m not thinking about race, thinking about being black and white, black or white, thinking about all of it.Black and white biracial woman, age 31
The quotes presented throughout this report come from a series of interviews conducted to create short videos about the multiracial experience in America. Participants all had parents with different racial or ethnic backgrounds.
Mixed Racial Background, but Not Multiracial
Further analysis of these results yielded one of the major findings of this study: An overwhelming majority of Americans whose reported family tree indicates a mixed racial background do not choose more than one race to describe their own race or origin.
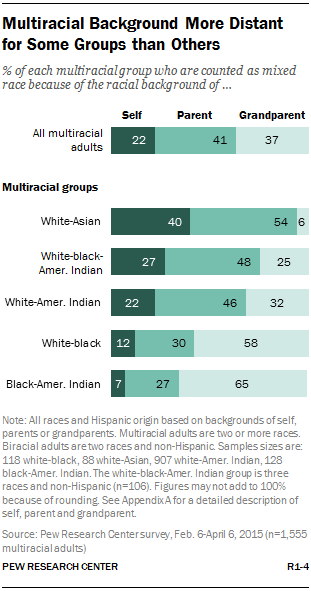
According to the survey, only 22% of adults with a mixed racial background (going back to their grandparents’ origins) report that they are two or more races when asked to describe their own race or origin.40 About three-quarters of those identified as having a multiracial background report they are only one race (74%) or report no races for themselves (4%),41 but in response to later questions say one or more biological parents or grandparents was a different race or had a mixed racial background. Specifically, four-in-ten (41%) say they are a single race or didn’t give a race for themselves but have a parent with a different racial background than their own or a mixed-race background. Nearly as many (37%) give a single race or no races for themselves and their parents but have a grandparent of a different or a mixed racial background.
Biracial adults with a white and Asian background (40%) are significantly more likely than biracial adults who are black and American Indian (7%), white and black (12%), or white and American Indian (22%) to name two races for themselves when asked about their race or origin.
Overall, fully 94% of all white and Asian biracial Americans either report having two races in their background or enter the multiracial population as a result of the races of their parents. Only 6% identify themselves and their parents as the same race but have a grandparent with a different racial background, the smallest proportion of any of the major groups to do so.
By contrast, only 7% of all black and American Indian biracial adults self-report two races, while 92% say they are single-race blacks. For about two-thirds (65%) of this group, the link to a mixed-race heritage comes from one or more grandparents who had a different racial background; in most cases the grandparents accounted for the American Indian portion of their background.
The Demographics of Multiracial Americans
In key ways, multiracial Americans are different from the country population as a whole.
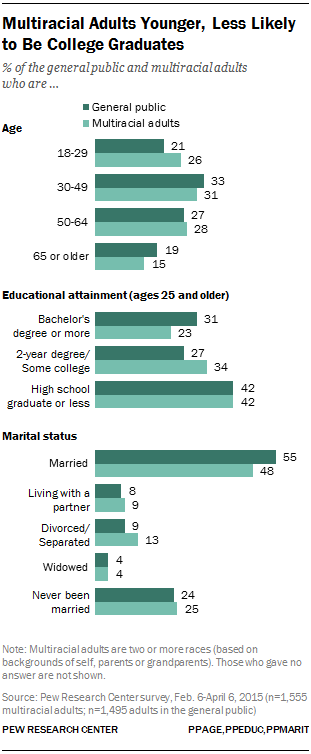
Multiracial Americans are younger, less likely to be college graduates and less likely to be currently married.
But on other measures, multiracial adults look very much like other Americans. Mixed-race adults are equally likely to be employed or attend religious services. And multiracial Americans as a group are just as likely as other adults to have children or live in a city, suburb or rural area.
Roughly a quarter (26%) of multiracial adults sampled for the Pew Research survey are younger than 30, compared with 21% of all adults surveyed. Mixed-race Americans also are somewhat less likely than others to be 65 or older (15% vs. 19%).
Some 48% of the multiracial adults surveyed are currently married, compared with 55% among all the adults who were surveyed. At the same time, mixed-race Americans are slightly more likely to be divorced or separated (13% vs. 9%).
On one key measure of economic well-being, multiracial adults lag slightly behind all adults—a smaller share are college graduates (23% vs. 31% among those ages 25 or older). However, a larger proportion of multiracial adults have completed at least a year of college (34% vs. 27%). An identical share (42%) of multiracial adults and the general public are high school graduates or have less education.
Gender
In the Pew Research study, women outnumber men by a ratio of 61% to 39% in the adult multiracial population, significantly different than the share of women in the country as a whole (52%).
The gender disparity in the Pew Research sample is due in part to the large gender imbalance among mixed-race blacks. Among all non-Hispanic multiracial black adults in the Pew Research sample, about seven-in-ten (69%) are women (58% among those who give more than one race for themselves and 71% among those who are multiracial through the racial backgrounds of their parents or grandparents).
Other national surveys have also found a large gender skew in the multiracial black population and the black population overall. In a 2014 Pew Research survey of more than 10,000 adults nationally, 61% of mixed-race non-Hispanic blacks (defined as the share reporting two or more races for their own race) and 55% of all non-Hispanic blacks were women. Women also comprise a disproportionately large share of the overall black population according to the Census Bureau’s Current Population Survey (CPS). In the latest available CPS data, non-Hispanic black women outnumber black men 55% to 45% among adults 18 and older.
Further analysis of the Pew Research multiracial survey finds that the large concentration of women, especially among multiracial black adults, did not alter the survey findings, as black men and women generally share many of the attitudes and experiences that were measured in the survey.
American’s Largest Multiracial Groups
From the five races currently recognized by the U.S. Census Bureau—white, black or African American, Asian, American Indian or Alaska Native, and Native Hawaiian or Pacific Islander—spring dozens of possible combinations of two or more races.
But the Pew Research Center survey finds that only five of those potential combinations—four non-Hispanic biracial groups and one group with three races—constitute more than 80% of the multiracial population. An additional 11% of the multiracial population consists of Hispanics who are any combination of two or more races (including 4.9% who are Hispanic, white and American Indian).
According to the survey, half of all adults with a multiracial background are white and American Indian (with no Hispanic background).42 The second-largest mixed-race group is black and American Indian (12%). Non-Hispanic white and black biracial adults make up 11% of the multiracial population.
Smaller shares are adults who report their background as white, black and American Indian with no Hispanic origin (6% of the mixed-race population) or white and Asian (4%). The remainder is some other non-Hispanic combination (5%) or Hispanic and two or more races (11%).
Comparison with Census Estimates
The methods used by Pew Research for measuring an individual’s racial background differ from those used by the Census Bureau. These different methods produce different estimates of the size of the multiracial population and specific mixed-race groups, the Pew Research study finds.
Estimates of the size of the multiracial population in the Pew Research study are based on the racial background of the individual, as well as the races of his or her parents and grandparents.
Census estimates reported in this study are largely based on the 2013 American Community Survey (ACS), which asks respondents only about their own racial and ethnic background, not that of their parents or grandparents.
Biracial adults with a white and American Indian background are the single largest mixed-race group of adults in the 2013 ACS and the Pew Research survey.43 But the relative size of this group differs significantly.
In the 2013 ACS, adults 18 and older who said they were non-Hispanic white and American Indian accounted for 25% of the mixed-race population compared with half in the Pew Research survey.44
What explains the differences? Beyond the different ways that the ACS and Pew Research surveys measured race, these data do not provide a definitive answer. But they do point to one possible contributing source: the faint ties that many of those who claim an American Indian background have to that part of their family heritage.
As noted elsewhere in this report, white and American Indian biracial adults are among the least likely of any group to identify as multiracial (25% vs. 70% among white and Asian biracial adults, for example). Only 22% say they have a lot in common with American Indians, while 61% say they have a lot in common with whites.
In fact, about six-in-ten (62%) of those with a white and Native American mixed-race background report their race as only as white when they are first asked their own race or origin; for this group, their family link to an American Indian relative comes through a parent or grandparent.
These results suggest that many in this group who do not give a multiracial race response for themselves may report their race as white in official government forms—a reflection of their racial identity but not necessarily their actual racial background or ancestry. But many of these same adults likely will report also having an American Indian racial identity in an anonymous online survey such as the one conducted by the Pew Research Center.

