Whites and Asians are more likely than Hispanics and blacks to be self-employed, and this racial and ethnic gap extends through most industries. Self-employed Asians and whites also have a greater likelihood of having paid employees and, among businesses with paid employees, white- and Asian-owned firms typically hire more workers than firms owned by Hispanics and blacks.
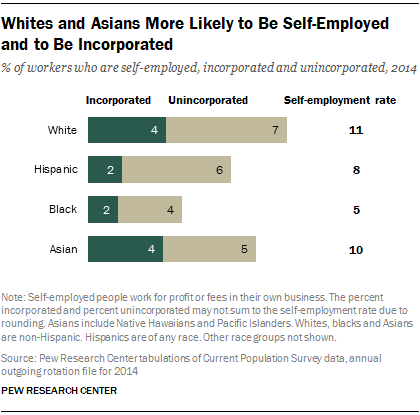
Some 11% of whites were self-employed in 2014, followed closely by Asians at 10%. Hispanics lagged behind a bit, with a self-employment rate of 8%. The self-employment rate among blacks was only 5%, about half of the rate among whites.
In terms of numbers, the nation’s 14.6 million self-employed workers in 2014 consisted of 10.8 million whites, 1.9 million Hispanics, 839,000 blacks and 812,000 Asians. Thus, whites accounted for 74% of all self-employed workers, compared with their share of 65% in overall employment. In sharp contrast, blacks accounted for only 6% of self-employment, compared with their share of 11% in total employment. Hispanics and Asians made up 13% and 6% of self-employment in 2014, compared with 16% and 6% of total employment, respectively.21
The rates of incorporation also vary across the groups. Among Asians and whites, 4% of all workers were self-employed and had incorporated businesses in 2014. That is double the share among Hispanics and blacks, among whom only 2% of workers were self-employed with incorporated businesses. Considered as a share of self-employed workers, 44% of self-employed Asians were in incorporated businesses in 2014, the highest rate of incorporation among racial and ethnic groups. The rate of incorporation was 39% among self-employed whites, 32% among self-employed blacks and 24% among self-employed Hispanics.
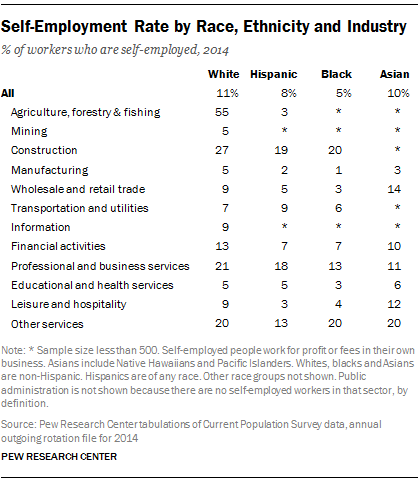
The racial and ethnic gap in self-employment extends through most industries. At least one-in-ten workers from any group were self-employed in three industries: construction, professional and business services, and other services.22 Whites were at the forefront in self-employment in all three sectors in 2014. For example, in professional and business services, 21% of whites were self-employed, compared with 18% of Hispanics, 13% of blacks, and 11% of Asians. Asians led in self-employment in wholesale and retail trade, as well as in leisure and hospitality.
Notably, in construction, self-employment among whites was higher than among Hispanics, by 27% to 19%. (The construction industry was of vital importance in providing employment opportunities for Hispanics, especially for immigrants, in the pre-Great Recession era.23) There was also a vast gulf in self-employment between whites and Hispanics in agriculture, forestry and fishing, by 55% to 3%.
Hiring Among the Self-Employed by Race and Ethnicity
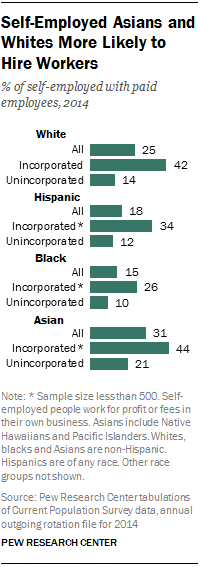
Asians who are self-employed are the most likely to employ others for pay. Nearly one-in-three self-employed Asians (31%) had at least one paid employee in 2014, compared with 25% of self-employed whites, 18% of self-employed Hispanics and 15% of self-employed blacks.
The relatively high hiring rate among self-employed Asians is driven by the unincorporated. Among self-employed workers with unincorporated businesses, 21% of Asians had paid employees in 2014, compared with 14% of whites, 12% of Hispanics and 10% of blacks. Among those with incorporated businesses, Asians (44%) and whites (42%) led other groups in hiring. Some 34% of incorporated businesses owned by Hispanics had paid employees, as did 26% of black-owned incorporated businesses.24 Within all groups, the incorporated are much more likely to hire than the unincorporated.
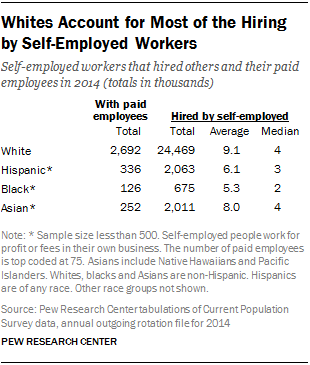
Whites, by the sheer size of their presence in the nation’s workforce, dominate in the number of jobs created by self-employed workers.25 Of the 29.4 million paid employees in businesses run by the self-employed in 2014, 24.5 million (83%) worked for white-owned businesses, 2.1 million (7%) for Hispanic-owned, 2 million (7%) for Asian-owned and 675,000 (2%) for black-owned.
The average number working for white-owned businesses with paid employees is also bigger. Self-employed whites with paid employees reported having 9.1 employees in 2014, compared with 8 for Asians, 6.1 for Hispanics, and 5.3 for blacks. However, at the median, these groups of workers employed fewer—four employees each among whites and Asians, three among Hispanics, and two among blacks.


