Immigrants are now a sizable segment of the U.S. workforce. In 2014, the nation’s 146 million workers included 24 million immigrants, accounting for 16.6% of total employment.26 Immigrants occupied an even more significant presence within the self-employed workforce last year. Some 2.8 million, or 19%, of the nation’s 14.6 million self-employed workers were immigrants. Thus, immigrants are also responsible for a good share of the jobs created by self-employed workers, hiring workers at virtually the same rate as the U.S. born.
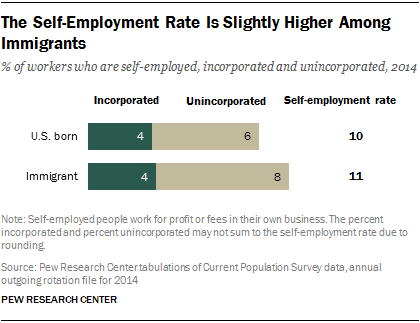
Overall, 11% of immigrant workers were self-employed in 2014, compared with 10% of U.S.-born workers. The incorporation rates are also similar. Some 4% of each group of workers had incorporated businesses. But there were proportionally more unincorporated self-employed immigrants than U.S.-born workers, 8% compared with 6%.
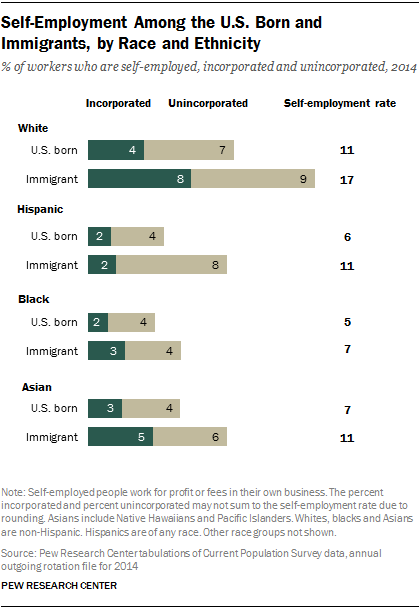
The overall similarity in self-employment masks the fact that immigrants outpace the U.S. born in the likelihood of being self-employed within each racial and ethnic group. The largest gaps appear among whites and Hispanics. Almost one-in-five (17%) white immigrants were self-employed in 2014, compared with 11% of whites who were U.S. born. Among Hispanics, immigrants were about twice as likely as those born in the U.S. to be self-employed, by 11% to 6%.
Among Asian workers, 11% of immigrants and 7% of the U.S. born were self-employed last year. The rates of self-employment among black immigrant workers (7%) and U.S.-born blacks (5%) were about the same. Notably, Hispanic and Asian immigrants were just as likely as U.S.-born whites to be self-employed.
Thus, when considered by racial and ethnic groups, the evidence shows that immigrants are engaged in running businesses far more than U.S.-born workers. The magnitude of the difference is muted in the aggregate, however, because of the vastly different racial and ethnic composition of the two groups. The immigrant workforce is almost all minorities—some 82% were Hispanic, Asian, black or some other race in 2014. This drags down the self-employment rate for immigrants in the aggregate. On the other hand, the U.S.-born workforce was mostly white, while only 25% were Hispanic, Asian, black or some other race.
Self-employed immigrants also outdo self-employed U.S.-born workers in running incorporated businesses. Among white immigrant workers overall, the 17% who were self-employed in 2014 included 8% who owned incorporated businesses and 9% who were unincorporated. Thus, within the universe of self-employed workers, almost half (46%) of white immigrants had incorporated their businesses. Among self-employed whites who are U.S. born, 39% had incorporated businesses (the 4% who had incorporated as a share of the 11% who are self-employed).27
Similarly, 46% of self-employed Asian immigrants owned incorporated businesses, compared with 37% of U.S.-born Asians. Among self-employed blacks, 40% of immigrants had incorporated businesses, compared with 30% of the U.S. born. However, among self-employed Hispanics, immigrants are less likely to incorporate their businesses, at a rate of 20% for immigrants compared with 30% for the U.S. born.
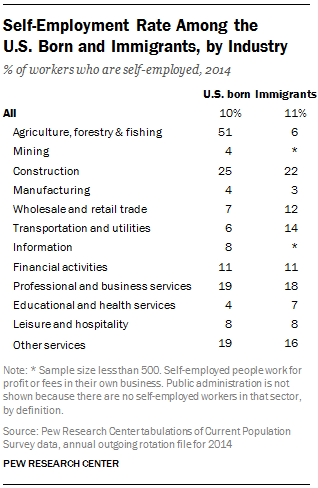
With a few exceptions, the self-employment rates for immigrants and U.S.-born workers tend to vary in tandem across industries. The major exception is agriculture, forestry and fishing, a sector in which 51% of U.S.-born workers were self-employed, compared with only 6% of immigrants. By contrast, immigrants have a notable edge over U.S.-born workers in self-employment in wholesale and retail trade—12% versus 7%—and in transportation and utilities, 14% versus 6%.28
More broadly, immigrants and U.S.-born workers share higher-than-average rates of self-employment in the same industries, such as construction, professional and business services, and other services, and lower-than-average rates of self-employment in several other industries, such as manufacturing, educational and health services, and leisure and hospitality.
Job Creation by Immigrant and U.S.-Born Self-Employed Workers
There is little difference in the shares of U.S.-born and immigrant self-employed workers that have paid employees. In 2014, 24% of self-employed workers born in the U.S. had paid employees, compared with 22% of self-employed immigrants. But notable differences in hiring practices emerge when immigrants and U.S.-born workers are classified by racial and ethnic groups.
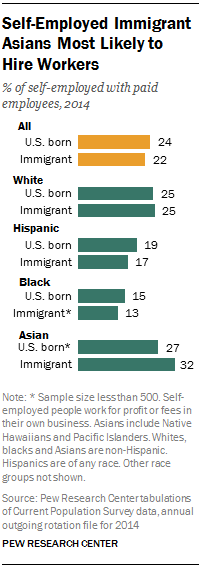
Among the self-employed, immigrant Asians are by far the most likely to have paid employees. One-in-three (32%) self-employed Asian immigrants had at least one paid employee in 2014. Trailing them were self-employed white immigrants, 25% of whom had paid employees in 2014. Hispanics and blacks lagged further behind among immigrants, with 17% and 13% doing some hiring, respectively.29
Whites lead in hiring among U.S.-born self-employed workers. In 2014, 25% of self-employed whites who are U.S. born had at least one paid employee. This outpaces the rate among U.S.-born Hispanics (19%) and blacks (15%). Some 27% of U.S.-born Asians are estimated to have paid employees in 2014, though this is subject to the caveat that the sample size is less than 500.
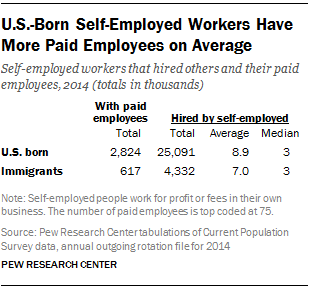
In number, U.S.-born workers comprise the clear majority of the self-employed with paid employees. Of the 3.4 million self-employed workers who had paid employees in 2014, 2.8 million are U.S. born and 617,000 are immigrants. The U.S. born had 25.1 million paid employees and immigrants had 4.3 million employees. Thus, the U.S. born accounted for 85% of total hiring by the self-employed and immigrants accounted for 15%.
The average employment size of businesses run by U.S.-born and immigrant self-employed workers is similar. The U.S. born had 8.9 paid employees and immigrants had 7 employees in 2014, on average. At the median, both groups of workers had only three employees.


