The share of adults who lived in lower-, middle- or upper-income households varied markedly across U.S. metropolitan areas in 2014. While 51% of American adults overall were in the middle-income tier in 2014, the share was as low as 42% in Monroe, LA, and as high as 67% in Wausau, WI. Differences in the shares of adults in the lower- and upper-income tiers were even more striking.
Metropolitan areas also differed with respect to the economic well-being of their household residents. The overall median household income was highest in Midland, TX, standing at $90,743 in 2014. That was more than double the median of $39,752 in McAllen-Edinburg-Mission, TX, the lowest among the areas analyzed. 23 There were notable gaps as well in the median incomes of households in lower-, middle- and upper-income tiers across areas.
The factors that determine the economic status of people in an area are just as varied. Broader market forces, global and national, play a role, as do local factors that affect how well an area is positioned to surf the economic tides.
For example, Midland, an area rich in energy resources, benefited from the boom in global oil prices in the post-Great Recession era (although the sharp decline in oil prices since 2014 may test its resiliency). Some areas, such as Hickory-Lenoir-Morganton, NC, a center for furniture manufacturing, were shaken by global competition in recent decades, losing upper- and middle-income jobs in the process. Yet more areas, such as San Jose-Sunnyvale-Santa Clara, CA, a leader in information technology with a highly educated workforce, have built economies that appear to be supple.
This chapter reviews the economic status of metropolitan areas in 2014 through the prism of income tiers. The chapter also shows how the sizes of income tiers are related to the median income and the degree of income inequality in metropolitan areas. Changes in the economic status of these areas from 2000 to 2014 are discussed in the next chapter. Detailed tables in Appendix B present the distributions of the adult population by income tier for all 229 metropolitan areas examined.
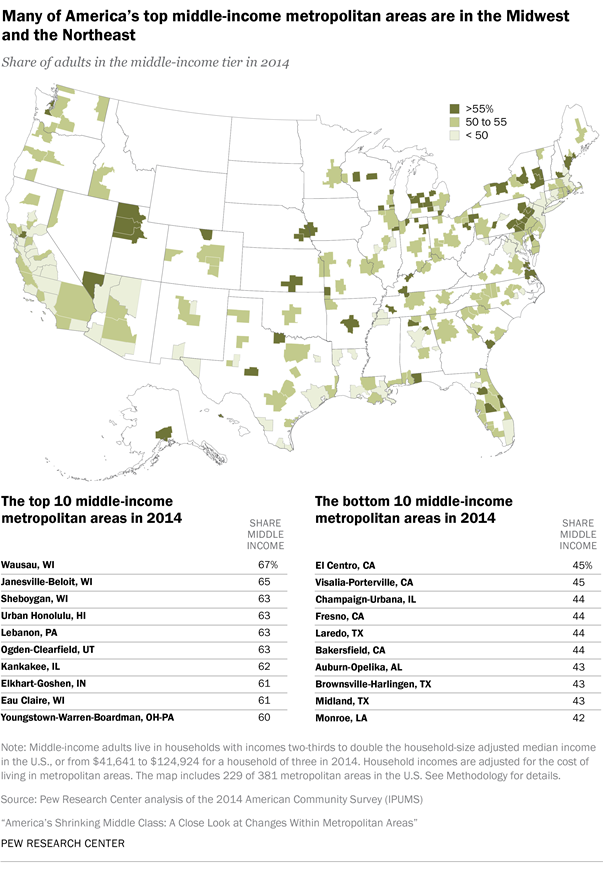
Metropolitan areas with the largest middle classes are mostly in the American Midwest and Northeast
The metropolitan area with the largest middle class in 2014 was Wausau, WI, in which 67% of adults lived in middle-income households. There were only nine other metropolitan areas, from among the 229 metropolitan areas examined, in which at least 60% of adults were middle income, compared with 51% nationally. This group included three more areas in Wisconsin: Janesville-Beloit, Sheboygan and Eau Claire. Only two areas outside of the Midwest and Northeast—Urban Honolulu, HI, and Ogden-Clearfield, UT—had at least a 60% share of middle-income adults.
In addition, there were 51 metropolitan areas in which 55% up to 60% of the adult population was middle income in 2014. The most prominent of these areas, in terms of population size, are Las Vegas-Henderson-Paradise, NV; Virginia Beach-Norfolk-Newport News, VA-NC; Salt Lake City, UT; and Rochester, NY.
Middle-income Americans are a slimmer majority of the adult population in most metropolitan areas. Of the 229 areas covered, there are 118 areas in which 50% up to 55% of the adult population was middle income in 2014. These areas are scattered about the country and include some of America’s most populated metropolitan areas, such as Chicago-Naperville-Elgin, IL-IN-WI; Dallas-Fort Worth-Arlington, TX; and Philadelphia-Camden-Wilmington, PA-NJ-DE-MD. Detroit-Warren-Dearborn, MI, with a middle-income share of 51%, was also part of this group in 2014.
But middle-income adults lacked a majority in 50 metropolitan areas in 2014. Notably, this group included Los Angeles-Long Beach-Anaheim, CA (47% middle income); San Francisco-Oakland-Hayward, CA (48%); New York-Newark-Jersey City, NY-NJ-PA (48%); Boston-Cambridge-Newton, MA-NH (49%); and Houston-The Woodlands-Sugar Land, TX (49%).
In some of these large metropolitan areas, such as the Boston and San Francisco areas, middle-income adults were in the minority because the upper-income tier was larger than average. But in the Los Angeles area the middle-income share in 2014 was relatively small because the lower-income tier was much larger than average, 37% versus 29% nationally.
Metropolitan areas with the 10 smallest middle classes were mostly to the south and the southwest. Monroe, LA, with a 42% middle-income share, brought up the rear. With one exception, the areas in this group have relatively large lower-income tiers. The exception is Midland, TX (43% middle income), which features the nation’s largest upper-income tier.
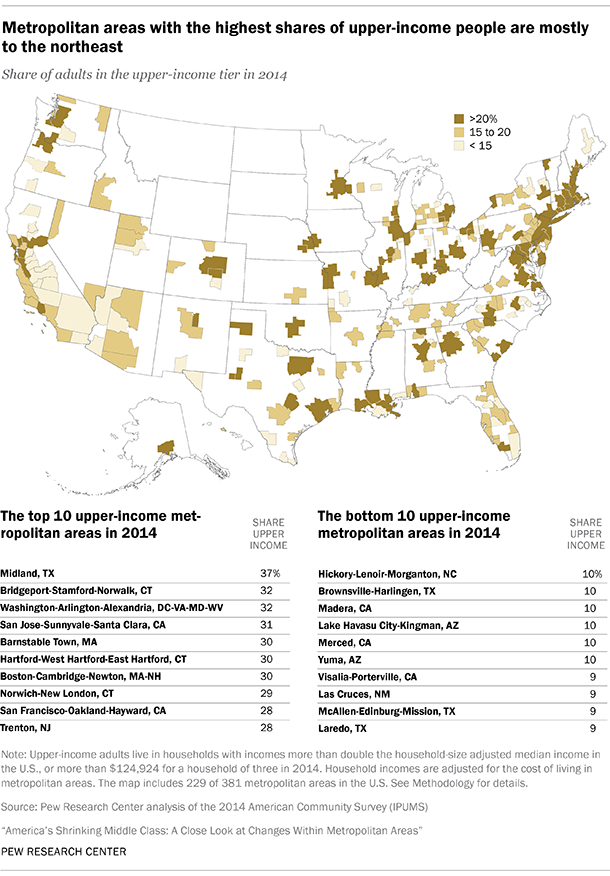
Metropolitan areas with the largest upper-income tiers are mainly to the northeast
Midland, TX, had the country’s largest upper-income tier in 2014. Some 37% of the adult population in Midland was upper income, nearly double the national share of 20%. But the other top 10 upper-income metropolitan areas in 2014 were either to the northeast, such as Bridgeport-Stamford-Norwalk, CT (32% upper income), or by the Pacific, such as San Francisco-Oakland-Hayward, CA (28%).
There were only 17 metropolitan areas, of the 229 areas analyzed, in which at least one-in-four adults was upper income in 2014. This group included a few metropolitan areas in the Midwest, such as Minneapolis-St. Paul-Bloomington, MN-WI, and Cincinnati, OH-KY-IN, both with a 25% upper-income share.
The share of adults in the upper-income tier was between 20% and 25% in 60 metropolitan areas in 2014. Situated mostly in Texas or points to the east, this group includes many of the country’s largest metropolitan areas. The list features New York-Newark-Jersey City, NY-NJ-PA, and Chicago-Naperville-Elgin, IL-IN-WI, each with a 21% upper-income share, along with Houston-The Woodlands-Sugar Land, TX (23%), and Detroit-Warren-Dearborn, MI (21%).
However, in the vast majority of metropolitan areas—152 of 229 areas—the share of adults in the upper-income tier was less than 20% in 2014. The share ranges from 15% to less than 20% in 93 metropolitan areas. The largest of these localities is Los Angeles-Long Beach-Anaheim, CA, where only 16% of the adult population was in the upper-income tier. Other notable areas in this group are Phoenix-Mesa-Scottsdale, AZ (19%); Tampa-St. Petersburg-Clearwater, FL (16%); and Las Vegas-Henderson-Paradise, NV (15%).
Seven metropolitan areas shared the distinction of having just up to one-in-ten adults in them living in upper-income households in 2014. These areas include Laredo, TX; McAllen-Edinburg-Mission, TX; Las Cruces, NM; and Visalia-Porterville, CA. Each had only a 9% upper-income share. Overall, there were 59 metropolitan areas in which less than 15% of the adult population was upper income. The most populated of these areas are Miami-Fort Lauderdale-West Palm Beach, FL (just shy of 15%), and Riverside-San Bernardino-Ontario, CA (13%).
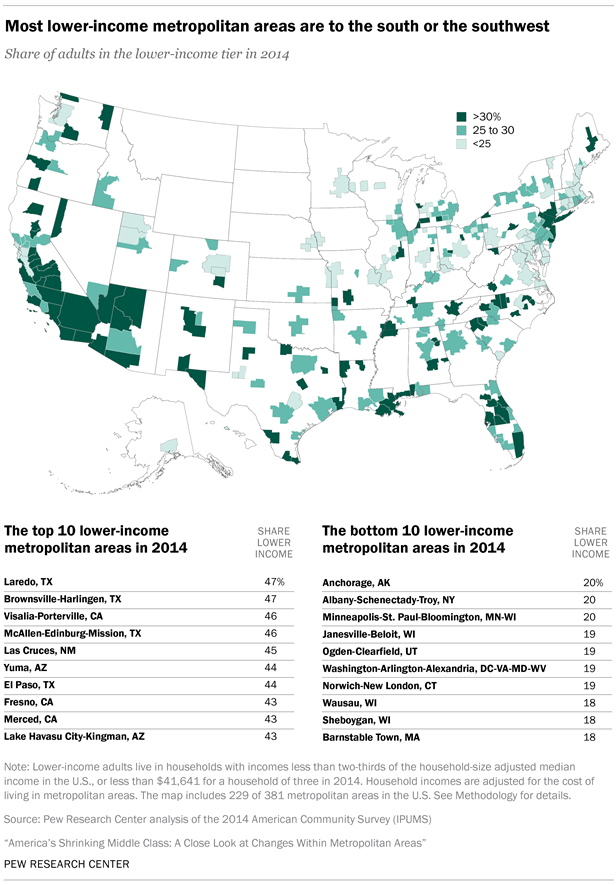
Metropolitan areas with larger lower-income tiers lie mostly to the south or the southwest
More American adults live in lower-income households than in upper-income ones, 29% vs. 20% nationally in 2014. Moreover, in a significant number of metropolitan areas—88 of 229—at least three-in-ten adults are lower income. Most of these areas are located in the country’s south or to the southwest.
The lower-income tier was largest in Laredo, TX, and Brownsville-Harlingen, TX, with 47% of adults in each area belonging to the lower-income tier in 2014. Not far behind were two other border communities in Texas, McAllen-Edinburg-Mission (46%) and El Paso (44%). Localities in central California, such as Visalia-Porterville (46%) and Fresno (43%), also have among the largest lower-income tiers in the country.
Overall, there are 14 metropolitan areas in which at least 40% of the adult population was lower income in 2014. The majority—10 of the 14—are either in California or Texas. Also, Hispanics accounted for more than half of the population in most of these lower-income metropolitan areas in 2014, compared with 17% nationally.
The country’s two largest metropolitan areas also had sizable lower-income tiers in 2014: 37% in the Los Angeles-Long Beach-Anaheim, CA, area and 31% in the New York-Newark-Jersey City, NY-NJ-PA, area. Other notable areas in which at least 30% of adults were lower income are Miami-Fort Lauderdale-West Palm Beach, FL; Riverside-San Bernardino-Ontario, CA; and San Diego-Carlsbad, CA.
There are 82 metropolitan areas in which 25% up to 30% of adults were lower income in 2014. These areas are distributed across the country and include the Chicago and Detroit areas in the Midwest, the Dallas, Houston and Phoenix areas to the southwest, the Atlanta and Charlotte areas in the old South, the Philadelphia area to the east and the Portland, OR, area to the west.
Not surprisingly, metropolitan areas that had relatively large middle- or upper-income tiers in 2014 also had relatively small lower-income tiers. For example, less than 20% of adults were in the lower-income tier in Janesville-Beloit, WI; Ogden-Clearfield, UT; Wausau, WI; and Sheboygan, WI; all of them are in the top 10 middle-income communities in the country. In addition, Washington-Arlington-Alexandria, DC-VA-MD-WV, and Barnstable Town, MA—two top-tier upper-income communities—had among the smallest lower-income tiers in 2014, 19% and 18%, respectively.
Incomes of households in lower-, middle- and upper-income tiers
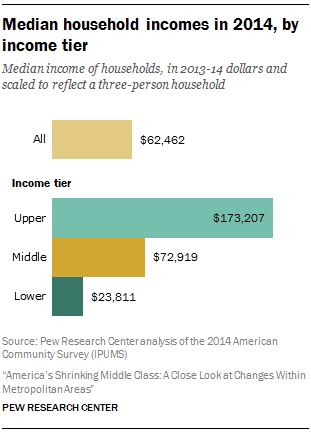
In 2014, the median income of U.S. households overall was $62,462, with half of households living on more than that amount and half living on less. Middle-class households, defined in this report as having incomes ranging from two-thirds to double the national median, had a median income of $72,919. Upper-income households were much better off, grossing $173,207 at the median. The median lower-income household earned only $23,811. 24
But the financial status of households ranged widely across metropolitan areas in 2014. Households in Midland, TX, with a median income of $90,743 in 2014, were the leaders among the 229 metropolitan areas examined. That was more than two times the median income of $39,752 for households in McAllen-Edinburg-Mission, TX, the lowest among the areas analyzed. 25
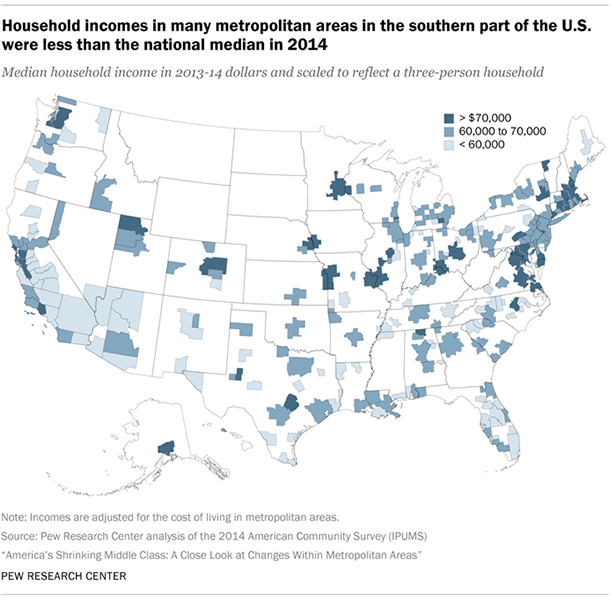
As shown in the accompanying map, metropolitan areas with relatively low median incomes—less than $60,000 in 2014—tend to be in the southern half of the U.S. Miami-Fort Lauderdale-West Palm Beach, Tampa-St. Petersburg-Clearwater and Orlando-Kissimmee-Sanford, three of Florida’s largest metropolitan areas, are in this group. So are Los Angeles-Long Beach-Anaheim and Riverside-San Bernardino-Ontario, both in California, and Las Vegas-Henderson-Paradise in Nevada. Overall, median household income was less than $60,000 in 88 of 229 metropolitan areas.
At the higher end of the income spectrum are 39 metropolitan areas in which the median household income was greater than $70,000 in 2014. The areas in this group are situated on both coasts, such as Boston-Cambridge-Newton, MA-NH, to the east and Seattle-Tacoma-Bellevue, WA, to the west, and in points in between, such as Denver-Aurora-Lakewood, CO; St. Louis, MO-IL; and Kansas City, MO-KS. In almost half the metropolitan areas—102 of 229—the median household income fell between $60,000 and $70,000 in 2014. The New York-Newark-Jersey City, NY-NJ-PA, area and several other large metropolitan areas are in this group, such as Chicago-Naperville-Elgin, IL-WI-IN; Dallas-Fort Worth-Arlington, TX; Atlanta-Sandy Springs-Roswell, GA; and Detroit-Warren-Dearborn, MI.26
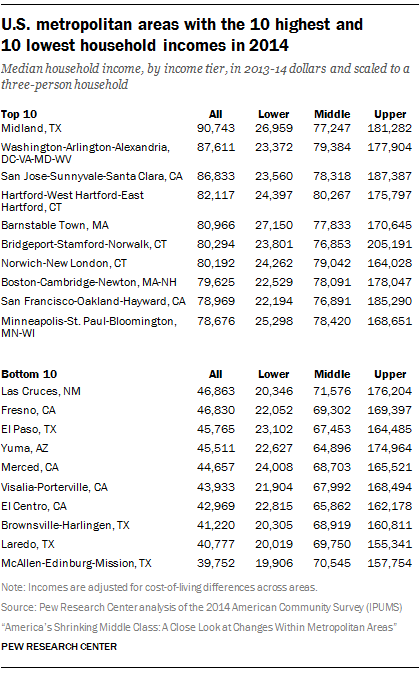
With one exception, the 10 metropolitan areas with the highest median incomes in 2014 are also the areas that have the largest shares of upper-income residents in the country. Among the areas on both lists are Midland, TX, and Barnstable Town, MA. The exception is Minneapolis-St. Paul-Bloomington, MN-WI, where the median household income was $78,676 in 2014. The share of adults in the upper-income tier in the Minneapolis area was 25%, putting it in the top 15 on that score.
Similarly, the 10 metropolitan areas with the lowest median incomes in 2014 are virtually the same as the areas with the largest lower-income tiers (in share) in the country. The one exception is El Centro, CA, with a median household income of $42,969 in 2014. The share of adults in the lower-income tier in the El Centro area was 42%, the 11th highest in 2014.
Incomes of middle-class households in U.S. metropolitan areas
Middle-class households, by definition, earned from $41,641 to $124,924 in all U.S. metropolitan areas in 2014. Within this range, there still was a notable variation in the median income of middle-class households across areas. That is because households in an area may cluster near the top or the bottom end of the middle-income range, or be more evenly spread. The size of the middle class in an area, as measured by the share of adults who are middle income, bore no relationship to the median income of the middle class.
Middle-class households fared the best in Racine, WI, with a median annual income of $81,283 in 2014. That was 26% greater than the median income of middle-class households in Hanford-Corcoran, CA, which stood at $64,549, the lowest in the country. But in the majority of metropolitan areas examined—138 of 229—the median middle-class income fell within the range of $70,000 to $75,000.
Of the 10 metropolitan areas with the highest incomes for middle-class households in 2014, one area—Lebanon, PA—also had one of the largest middle-class shares in the country (63% of adults). The middle-class share was closer to the national average in the other nine areas, ranging from 49% in the Hartford-West Hartford-East Hartford, CT, and Washington-Arlington-Alexandria, DC-VA-MD-WV, areas to 56% in Anchorage, AK, and Manchester-Nashua, NH. However, the share of the upper-income tiers was generally above average in this group of metropolitan areas.
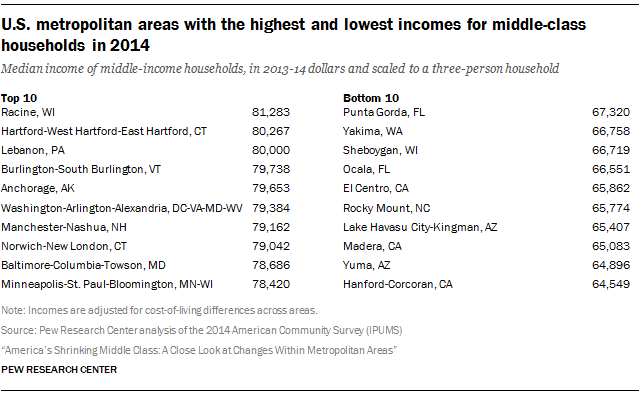
The group of 10 metropolitan areas with the lowest incomes for middle-class households in 2014 includes Sheboygan, WI, in which 63% of adults were middle class. Also on this list is El Centro, CA, with one of the smallest middle-class shares in the country, along with Yuma, AZ, and Lake Havasu City-Kingman, AZ, which had among the biggest lower-income tiers (in share) in the U.S. Generally speaking, the upper-income tiers in these 10 areas were smaller than average in 2014, and the lower-income tiers were larger than average.
Incomes of households in the lower-income tier
Lower-income households had incomes of less than $41,641 in 2014. Subject to that constraint, the median income of these households was highest in Burlington-South Burlington, VT, at $30,943. At the bottom, the median income of lower-income households was only $18,113 in State College, PA. In the majority of metropolitan areas—163 of 229—the median income in the lower-income tier was within $20,000 up to $25,000 in 2014.
Several metropolitan areas with relatively high incomes for the lower-income tier were above average on other indicators as well—they either had large shares of adults who were middle income or upper income in 2014. This list includes Sheboygan, Wausau and Eau Claire, all in Wisconsin, and East Stroudsburg, PA; Barnstable Town, MA; and Ogden-Clearfield, UT.
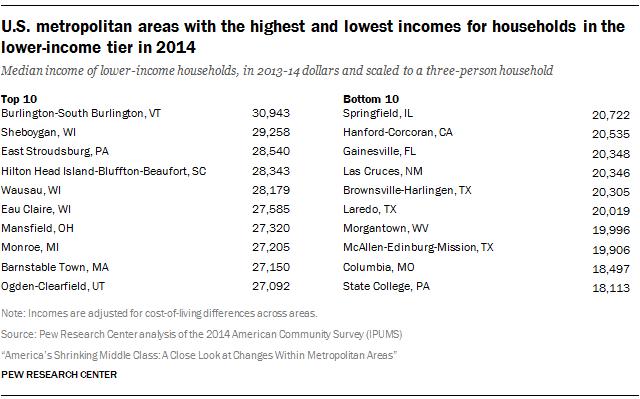
At the other extreme, metropolitan areas in which lower-income households had among the lowest median incomes were also areas with relatively large shares of adults in the lower-income tier in 2014. In particular, at least 35% of adults were lower-income in Hanford-Corcoran, CA; Gainesville, FL; Las Cruces, NM; Morgantown, WV; State College, PA; and also in the following areas in Texas: Brownsville-Harlingen, Laredo and McAllen-Edinburg-Mission.
Incomes of households in the upper-income tier
The upper-income tier consists of households that reported an income of $124,925 or more in 2014. Among these households, the median income ranged from $149,644 in Decatur, AL, to $205,191 in Bridgeport-Stamford-Norwalk, CT. Bridgeport was the only metropolitan area in which median income exceeded $200,000. In most metropolitan areas—184 of 229—the median income of the upper-income tier in 2014 fell shy of $175,000.
Only three of the 10 metropolitan areas with the highest-earning upper-income households had relatively large shares of adults in the upper-income tier. These three areas are Bridgeport-Stamford-Norwalk, CT; San Jose-Sunnyvale-Santa Clara, CA; and San Francisco-Oakland-Hayward, CA. Three other areas—Monroe, LA; Santa Cruz-Watsonville, CA; and Santa Maria-Santa Barbara, CA—had sizable lower-income tiers with at least three-in-ten adults in that tier.
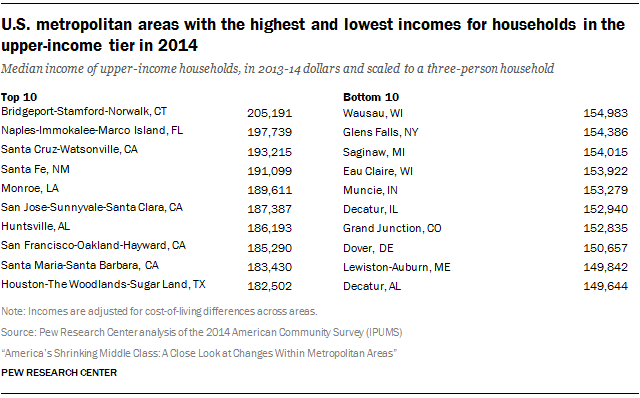
Among the 10 metropolitan areas with the lowest incomes for upper-income households, several featured relatively large middle classes. In this group, there are six areas in which at least 55% of adults were middle income in 2014: Wausau, WI; Glens Falls, NY; Saginaw, MI; Eau Claire, WI; Dover, DE; and Decatur, AL. Only one area, Muncie, IN, had more than three-in-ten adults in the lower-income tier.
Median incomes and income inequality are related to shares of adults in lower-, middle- and upper-income tiers
The shares of adults who are in the lower-, middle- or upper-income tiers reflect two key facets of the income distribution in a metropolitan area—the overall median household income in the area and the degree of income inequality, that is, the gap in the earnings of households near the top of the income distribution and the earnings of those near the bottom.
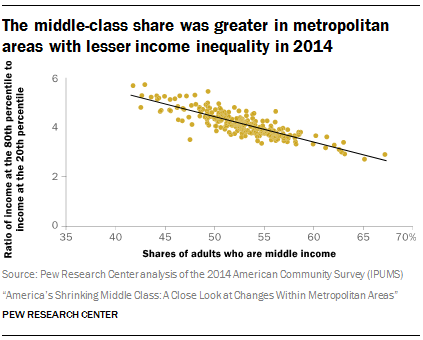
The extent of income inequality is strongly related to the middle-class share in a metropolitan area. Middle-income adults are a larger share of the adult population in areas with less income inequality and a smaller share of the adult population in areas with more inequality.
The following scatter plot depicts the general relationship between the middle-class share and income inequality. In the scatter plot, inequality is measured by the ratio of the incomes of households near the top (80th percentile in the income distribution) and the incomes of households near the bottom (20th percentile), or the 80/20 ratio. 27 The inverse relationship between the middle-class share and income inequality is evident and strong.
For example, Wausau, Janesville-Beloit and Sheboygan, the three areas with the largest middle classes in the U.S., had among the lowest levels of income inequality in 2014 across the U.S. metropolitan areas studied. In these three localities, all in Wisconsin, households at the 80th percentile had incomes about three times as high as the incomes of households at the 20th percentile. Conversely, the middle-class shares were among the lowest in Auburn-Opelika, AL, and Monroe, LA, and in these two localities the 80/20 income ratio was nearly as high as six.
The relationship between income inequality and the middle-class share shows that one is a reflection of the other. 28 When incomes of households near the bottom of the distribution are closer to the incomes of households near the top, it means that relatively more households may be found sitting within a narrower band of income. In other words, it raises the likelihood that more households are situated within the $41,641-to-$124,924 income band that defines the middle class. Meanwhile, if the distance between the top and bottom reaches of the income distribution is stretched farther, households are spread thinner and fewer of them are likely to fall within the middle-income band.
However, the median income in an area is not related to the share of adults who are in the middle class. That is because as the median household income increases, the middle-class share may increase because households leave the lower-income tier and join the middle—or the middle-class share may decrease because households transition from the middle- to the upper-income tier. The middle-class share may even remain unchanged if the movements out of the lower-income tier and into the upper-income tier balance each other out.
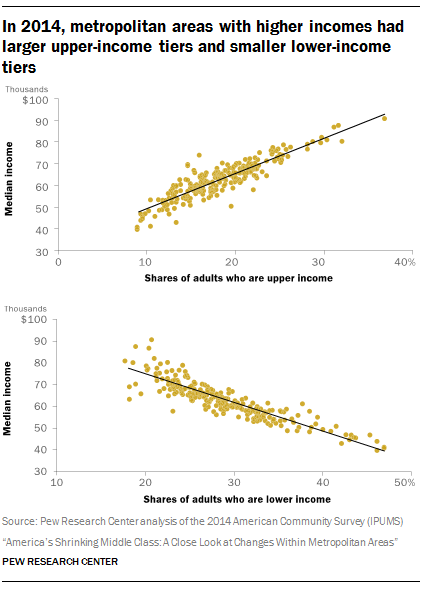
But the median income in an area does show the expected relationship with the shares of adults in upper- and lower-income tiers. In communities with higher overall median incomes, relatively more households may be expected to earn more than the $124,924 threshold for entry into the upper-income tier. A greater share of households may also be expected to earn more than $41,641, the way out of the lower-income tier. For example, in Midland, TX, the metropolitan area with the largest upper-income tier (37% of adults), the median household income was 45% greater than the national median income. In comparison, in Laredo, TX, one of the areas with the smallest upper-income tier (9% of adults), the median household income was 35% less than the national median income in 2014.
The more general relationships between median incomes in metropolitan areas and the shares of adults in lower- and upper-income tiers are depicted in the accompanying scatter plots. The relationships are as expected, and they are strong: as median income increases across metropolitan areas, the share of adults who are upper income increases in tandem, and the share of adults who are lower income decreases in close fashion. 29


