The economic status of a metropolitan area in 2014 does not necessarily signal the direction of its journey. Midland, TX, led the nation in the share of the population that was upper income in 2014 because it benefited from a boom in global oil prices. But the sharp decline in oil prices since 2014 may put the Midland economy to the test.
Meanwhile, McAllen-Edinburg-Mission, TX, an area with one of the largest lower-income tiers in 2014, is on an upswing. Thanks to economic diversification and rising trade with Mexico, the middle-class share in the McAllen area has grown in recent years. These developments could also nurture a brighter future for the McAllen economy.
This chapter discusses the changes in the economic statues of metropolitan areas from 2000 to 2014. It focuses on overall changes in the economic status of adults, that is, on whether they experienced more movement up the income ladder than down the ladder. The chapter also shows how household incomes changed in metropolitan areas from 1999 to 2014. 30 Some of the evidence is presented in tables and maps in Appendix B, and additional data are available online.
The decline nationally in the share of adults who are middle class proved to be a pervasive local phenomenon in the period from 2000 to 2014. Among the 229 metropolitan areas examined, the share of adults living in middle-income households decreased in 203 areas. As the middle-class share declined, the share in the lower-income tier rose in 160 areas and the share in the upper-income tier increased in 172 areas. These trends were not mutually exclusive—the shares of adults in the lower- and upper-income tiers both increased in 108 metropolitan areas.
The hollowing in the middle of the income distribution has been accompanied by widespread erosion in the incomes of households from 1999 to 2014. Underscoring the lingering effects of the Great Recession of 2007-09, the median income of middle-income households fell in 222 of 229 metropolitan areas. The median income also fell in 221 areas for lower-income households and in 215 areas for upper-income households. All three tiers experienced a simultaneous loss in median income in 202 areas.
Metropolitan areas were about as likely to experience a gain in economic status as a loss
The economic status of a metropolitan area may be said to improve if more adults in the area experience a movement up the income ladder than down the ladder. A movement up the ladder could mean either a progression from the lower-income tier to the middle or from the middle-income tier to the upper-income tier. A movement down the ladder refers to either a decrease in the share of adults in the upper-income tier or an increase in the share in the lower-income tier.
In the U.S. overall, the share of adults in the middle class fell from 55% in 2000 to 51% in 2014. This decline in the middle was accompanied by dispersal in two directions. First, the share of adults in the upper-income tier increased from 17% to 20%, a change of 2 percentage points. 31 Second, the share of adults in the lower-income tier rose from 28% to 29%, an increase of 1 percentage point. The difference between these opposing movements—1 percentage point—is the net gain for American adults.
By this yardstick, U.S. metropolitan areas were roughly evenly divided between those that experienced an overall gain in economic status from 2000 to 2014 (the winners) and those that experienced an overall loss in economic status (the losers). In particular, across the 229 metropolitan areas analyzed, 119 were winners, with adults more likely to climb than to descend the income ladder, and 110 were losers. 32
The modest gain in economic status nationally—a net gain of 1 percentage point—concealed big differences in outcomes across metropolitan areas from 2000 to 2014. The biggest winners were Odessa and Midland, two energy-rich areas in Texas that each experienced a net gain of 26 percentage points. At the opposite end of the spectrum were Goldsboro, NC, and Springfield, OH, tied with a net loss of 16 percentage points in economic status. 33
There is no unifying thread that binds the biggest winners among the metropolitan areas. In Louisiana, for example, industries such as shipping and petrochemicals play large roles in New Orleans-Metairie and Baton Rouge, but information technology is more significant to the Lafayette economy. Meanwhile, Amarillo, TX, is principally a meat packing economy, while Barnstable Town, MA, is a tourist destination.
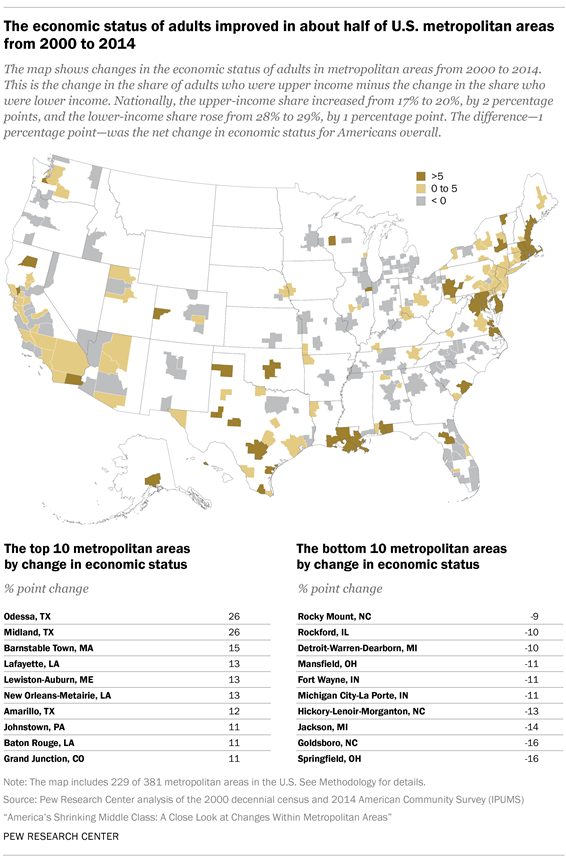
Overall, 43 metropolitan areas registered a net gain of at least 5 percentage points in the economic status of their adult populations. These areas are concentrated to the northeast and the Gulf Coast (see the accompanying map). The most prominent urban centers in this group are Washington-Arlington-Alexandria, DC-VA-MD-WV (net gain of 6 percentage points), and Boston-Cambridge-Newton, MA-NH (net gain of 7 percentage points).
The metropolitan areas that were among the biggest winners from 2000 to 2014 did not necessarily have relatively large upper-income tiers in 2014 as a result. For example, McAllen-Edinburg-Mission, TX, is one of the big winners, with a net gain of 8 percentage points. This is mainly because the share of adults who are lower-income in the McAllen area fell from 53% in 2000 to 46% in 2014. This led to an increase in the middle-class share from 39% to 45% and an increase in the upper-income share from 8% to 9%. But while the McAllen area retained one of the largest lower-income tiers in the country in 2014 and a smaller-than-average middle-class share, its economy appears to have improved significantly in recent years.
The second tier of winners—those with a net gain of up to 5 percentage points from 2000 to 2014—encompasses 76 metropolitan areas. These areas are generally dispersed across the country, although they appear more sparsely in the Rust Belt and in states due south. The two largest metropolitan areas in the country—New York-Newark-Jersey City, NY-NJ-PA, and Los Angeles-Long Beach-Anaheim, CA—are in this group.
The economies in the 10 metropolitan areas with the greatest losses in income status from 2000 to 2014 shared a greater-than-average reliance on manufacturing. Many of these areas are in the Rust Belt, including Springfield, OH, which, along with Goldsboro, NC, experienced the greatest loss in the country with a decrease of 16 percentage points.. The share of adults in the lower-income tier rose from 21% in 2000 to 32% in 2014 in Springfield, and the share in the upper-income tier fell from 18% to 13%.
The 10 areas that slipped the most in economic status are also generally struggling to recover jobs that were lost with the recessions this century. From 2000 to 2014, job losses in manufacturing in these areas ranged from 23% in Fort Wayne, IN, to 51% in Hickory-Lenoir-Morganton, NC, compared with 29% nationally. Other sectors did not entirely pick up the slack as overall private sector employment also fell, ranging from 3% in Goldsboro, NC, to 25% in Hickory-Lenoir-Morganton, NC. By comparison, private sector employment in the U.S. overall increased 5% from 2000 to 2014.
Atlanta-Sandy Springs-Roswell, GA, and Detroit-Warren-Dearborn, MI, are the largest of the metropolitan areas to experience a loss of at least 5 percentage points from 2000 to 2014. The loss was 8 percentage points in the Atlanta area and 10 percentage points in the Detroit area. Both areas experienced sizable increases in the shares of adults in the lower-income tier, from 20% to 27% in the Atlanta area and from 21% to 28% in the Detroit area. Other large metropolitan areas to experience losses include Chicago-Naperville-Elgin, IL-IN-WI; Dallas-Fort Worth-Arlington, TX; and Miami-Fort Lauderdale-West Palm Beach, FL, although the loss in each was less than 5 percentage points.
While the economic trajectory pointed down in 110 metropolitan areas, these are not necessarily areas with large shares of adults in the lower rungs of the income distribution. The majority of adults in most of these areas were in the middle class in 2014, including in predominantly middle-class communities such as Wausau, WI; Janesville-Beloit, WI; and Elkhart-Goshen, IN. Some other areas, such as Minneapolis-St. Paul-Bloomington, MN-WI, and Raleigh, NC, had larger-than-average upper-income tiers in 2014.
Changes in the shares of adults in lower-, middle- and upper-income tiers from 2000 to 2014
As discussed, the net economic gain or loss in a metropolitan area is the combination of changes in the shares of adults in the upper- and lower-income tiers. In turn, a change in the relative size of either tier is often accompanied by a change in the middle-class share. A table and a set of maps in Appendix B show the change in the share of adults in each income tier in the 229 metropolitan areas covered in this report.
The share of adults in the middle-income tier fell in 203 metropolitan areas. One of the greatest decreases was in Goldsboro, NC, where the middle-class share dropped by 12 percentage points, from 60% in 2000 to 48% in 2014. The greatest increase was in McAllen-Edinburg-Mission, TX, where the share rose by 6 percentage points, from 39% to 45%. In some 127 metropolitan areas, the middle-class share decreased by more than the nationwide drop of 3.6 percentage points.
The share of adults in the upper-income tier increased in 172 metropolitan areas. The leader was Midland, TX, where the share of the upper-income tier about doubled, from 18% in 2000 to 37% in 2014. At the other end of the spectrum was Springfield, OH, where the upper-income share fell from 18% to 13%, a loss of 5 percentage points. Some 101 areas exceeded the nationwide increase of 2.2 percentage points in the share of the upper-income tier.
The share of adults in the lower-income tier rose in 160 metropolitan areas. The biggest increase was 14 percentage points in Goldsboro, NC, where the lower-income share jumped from 27% in 2000 to 41% in 2014. Odessa, TX, experienced the largest decrease in the lower-income share, cutting it by 15 percentage points, from 39% to 24%. Some 122 metropolitan areas shared the unfortunate distinction of exceeding the 1.4 percentage point increase in the lower-income share nationally.
Incomes of households in all income tiers decreased around the country
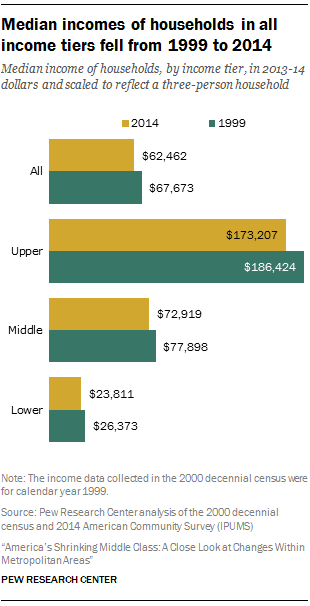
The redistribution of adults across the three economic tiers is one way to look at the change in the economic status of a metropolitan area from 2000 to 2014. But what about the fortunes of middle-class households, or the finances of households in the lower- and upper-income tiers in an area? Did they improve or worsen in the recent past? As it turns out, households in all income tiers were financially worse off in 2014 than in 1999 in the vast majority of metropolitan areas.
The median income of households in all three economic tiers—lower, middle and upper—decreased substantially from 1999 to 2014. Nationally, the median income of all households combined fell from $67,673 in 1999 to $62,462 in 2014, or by 8%. Among middle-class households, the median income shrank from $77,898 in 1999 to $72,919 in 2014, a reduction of 6%. The median incomes of lower-income and upper-income households fell by 10% and 7%, respectively. 34
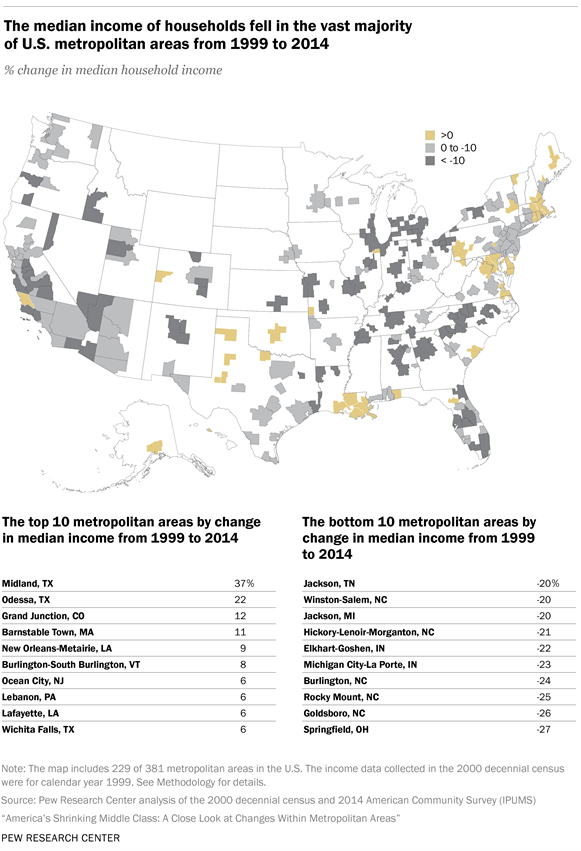
The financial setback for households was a shared experience across virtually all metropolitan areas. The overall median income fell in 190 of 229 areas from 1999 to 2014. The greatest loss was in Springfield, OH, where the median household income plunged 27%, from $73,895 in 1999 to $53,957 in 2014. (Data on median incomes in all 229 areas, by income tier, are available online in a set of supplementary tables.)
What transpired in Springfield was not an isolated development. Seven other communities sustained losses of at least 20%. Four of these areas were in North Carolina: Goldsboro, Rocky Mount, Burlington and Hickory-Lenoir-Morganton. 35
More generally, double-digit losses in median incomes (10% or more from 1999 to 2014) prevailed in 95 metropolitan areas. As seen in the following map, these metropolitan areas are to be found around the country, with the exception of the northeastern coast. The most populated metropolitan areas in this group are Chicago-Naperville-Elgin, IL-IN-WI; Miami-Fort Lauderdale-West Palm Beach, FL; and Atlanta-Sandy Springs-Roswell, GA.
Additionally, median incomes fell by up to 10% in 95 other metropolitan areas. The New York and Los Angeles areas belong to this group of metropolitan areas. Many of the country’s largest metropolitan areas fall into this category too, including Dallas-Fort Worth-Arlington, TX; Houston-The Woodlands-Sugar Land, TX; Philadelphia-Camden-Wilmington, PA-NJ-DE-MD; San Francisco-Oakland-Hayward, CA; Phoenix-Mesa-Scottsdale, AZ; and Riverside-San Bernardino-Ontario, CA.
A small group of metropolitan areas, 39 in all, experienced an increase in median household income from 1999 to 2014. Midland, TX, in which the median income increased by 37%, stands out in this select group of localities. Household incomes rose by more than 20% in only one other area—Odessa, TX. There are only 10 areas in which the median household income increased by more than 5% from 1999 to 2014. The two largest metropolitan areas to experience rising incomes in this period are Washington-Arlington-Alexandria, DC-VA-MD-WV, and Boston-Cambridge-Newton, MA-NH.
Changes in the incomes of middle-class households
Middle-class households across the country experienced a financial shock from 1999 to 2014 as their median income decreased in 222 of the 229 metropolitan areas examined.
Metropolitan areas with relatively large shares of adults in the middle class were not immune to the squeeze on their finances. In fact, among the middle class, the largest decrease in median income was felt by households in Sheboygan, WI. In Sheboygan, where 63% of adults are middle class, the median income of middle-class households fell by 17%, from $80,281 in 1999 to $66,719 in 2014. As a result, compared with its peers, the middle class in Sheboygan ranked among the bottom 10 in earnings in 2014.
Other largely middle-class localities that experienced significant losses in income include Janesville-Beloit and Eau Claire in Wisconsin and Elkhart-Goshen in Indiana. The middle class in these areas experienced at least a 10% decrease in median income from 1999 to 2014. Thus, while these communities retained their middle-class character in 2014, the financial security of middle-class households in them has deteriorated relatively sharply since 1999.
Overall, the median income of middle-class households fell by at least 10% from 1999 to 2014 in 30 metropolitan areas. More commonly, middle-class incomes decreased from 5% up to 10% in 127 metropolitan areas and by up to 5% in 65 other areas.
The middle class gained financially in only seven metropolitan areas. Midland, TX, was one of the areas in this spare group, but only because the median middle-class households there continued to earn about $77,000 in 2014, just as it did in 1999. The largest gain in income for the middle class was in Grand Junction, CO, where the median increased from $72,152 in 1999 to $75,949, or by 5%.
Changes in the incomes of households in the upper-income tier
Households in the upper-income tier were not immune to harder times financially. From 1999 to 2014, the median income of the upper-income tier fell in 215 of the 229 metropolitan areas examined.
Among upper-income households, the greatest decrease in income transpired in Naples-Immokalee-Marco Island, FL, where the median fell from $253,117 in 1999 to $197,739 in 2014, a loss of 22%. In about a quarter of metropolitan areas—54 of 229—the median income of upper-income households in 2014 was at least 10% lower than in 1999. Perhaps ironically, this group included Midland, TX, the area that registered the greatest increase in the share of adults in the upper-income tier. The median income of the upper-income tier in Midland dropped from $202,270 in 1999 to $181,282 in 2014. 36
For the upper-income tier, losses in the order of 5% to 10% were most common, prevailing in 114 metropolitan areas. Several areas with relatively large upper-income tiers in 2014 belong to this group, including Barnstable Town, MA; Boston-Cambridge-Newton, MA-NH; Bridgeport-Stamford-Norwalk, CT; Norwich-New London, CT; and San Francisco-Oakland-Hayward, CA. In addition, the incomes of upper-income households fell by up to 5% in 47 areas.
The 14 metropolitan areas in which the upper-income tier improved financially from 1999 to 2014 were led by Muskegon, MI. In Muskegon, the median income of the upper-income tier increased by 7%, from $165,709 in 1999 to $177,981 in 2014. The upper-income tier in State College, PA, also did better over time as its median income inched up 1%. Combined with the sharp decrease in the income of the lower-income tier (see next section), income inequality rose sharply in State College. 37
Changes in the incomes of households in the lower-income tier
Akin to the experience of the middle class, the median income of households in the lower-income tier decreased in 221 of the 229 metropolitan areas examined. But lower-income households took more of a financial blow from 1999 to 2014.
Within the lower-income tier, the greatest loss was felt by households in State College, PA. The median income of lower-income households there decreased from $26,190 in 1999 to $18,113 in 2014, or by 31%. Overall, losses of at least 10% were experienced by lower-income households in 134 metropolitan areas, including 35 areas in which their median income fell by at least 15%. The latter group of 35 included Laredo, TX; Yuma, AZ; and Las Cruces, NM—three areas with among the 10 highest shares of adults in the lower-income tier in 2014.
The small group of metropolitan areas in which lower-income households experienced gains in income is led by Burlington-South Burlington, VT. In that area, the median income of the lower-income tier rose from $27,674 in 1999 to $30,943 in 2014, an increase of 12%. The lower-income tiers in Odessa, TX, and Midland, TX, also experienced modest gains in income, by 2% and 1%, respectively.
Changes in income and income inequality are related to changes in the shares of adults in lower-, middle- and upper-income tiers
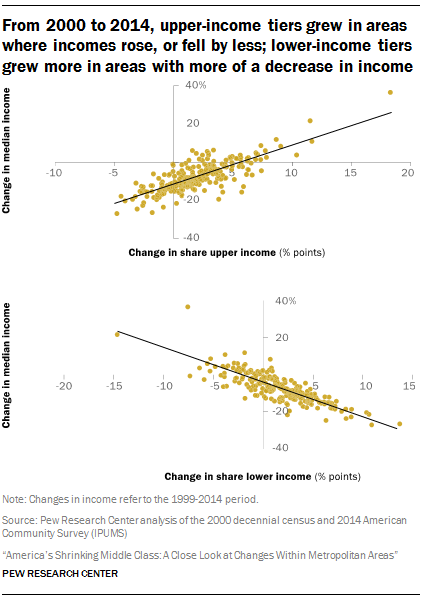
The shares of adults in lower-income households increased in most U.S. metropolitan areas from 2000 to 2014. How much this share increased is related to how much the median income in an area decreased—the more steeply incomes fell, the more the lower-income share increased. Similarly, areas with higher growth in median incomes, or less of a decrease, were more likely to experience an increase in the share of adults in the upper-income tier.
Changes in the share of adults in the middle class are not related to changes in median income, but they are related to changes in the degree of income inequality. Across metropolitan areas, greater increases in income inequality are associated with greater decreases in the middle-class share.
The general relationships between the change in median incomes in metropolitan areas and the change in the shares of adults in lower- and upper-income tiers are depicted in the accompanying scatter plots. The relationships are evidently strong and as described. 38
Toward one end is an area such as Odessa, TX, where the overall median income increased by 22% from 1999 to 2014. In Odessa, the lower-income share decreased by nearly 15 percentage points from 2000 to 2014 and the upper-income share increased by about 12 percentage points. Toward the other end is an area such as Springfield, OH, where the overall median income plunged 27%. Related to this drop in income, the lower-income share in Springfield increased 11 percentage points from 2000 to 2014 and the upper-income share decreased 5 percentage points.
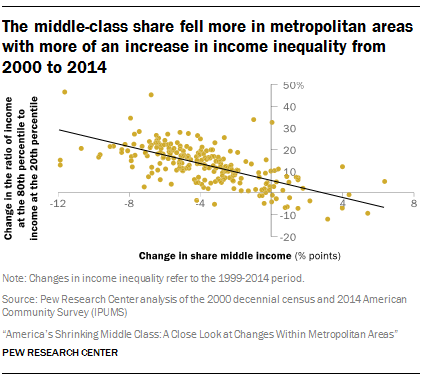
Increases in income inequality were the norm in U.S. metropolitan areas this century. From 1999 to 2014, the ratio of the incomes of households at the 80th percentile in the income distribution and the incomes of households at the 20th percentile, the 80/20 ratio, increased in 211 of the 229 areas.
Bigger increases in inequality are associated with larger decreases in the middle-class share. 39 In Springfield, IL, for example, the 80/20 ratio increased 46%, from 3.2 in 1999 to 4.7 in 2014. Meanwhile, the middle-class share in Springfield fell by 12 percentage points.
Twelve of the 18 metropolitan areas in which inequality decreased from 1999 to 2014 experienced an increase in the middle-class share. This group included Hilton Head Island-Bluffton-Beaufort, SC, where the middle-class share increased 5 percentage points; Madera, CA (4 points); Urban Honolulu, HI (4 points); Odessa, TX (3 points); and Kankakee, IL (2 points). These changes in the middle-class share ranked among the 10 largest increases in the U.S. from 2000 to 2014.


