A shifting economic landscape is driving significant changes in the American workplace. Employment opportunities increasingly lie in jobs requiring higher-level social or analytical skills, or both. Physical or manual skills, as much in demand as social or analytical skills some three decades ago, are fading in importance. Not coincidentally, employment is rising faster in jobs calling for greater preparation, whether through education, experience or other forms of training.
These changes have played out surely and steadily in recent decades. A key factor is the decline in manufacturing employment, by about a third just since 1990. Meanwhile, employment in knowledge-intensive and service-oriented sectors, such as education, health, and professional and business services, has about doubled. Underlying factors such as globalization, outsourcing of jobs and technological change are among the key forces contributing to the transformation.
Americans are taking note of these trends. Respondents to the accompanying Pew Research Center survey report that interpersonal skills, critical thinking, and good writing and communications skills are the most important skills for doing their jobs. And the share of adults ages 25 and older with a bachelor’s degree or higher level of education increased from 17% in 1980 to 33% in 2015. Most of these workers are engaged in jobs requiring higher-level social or analytical skills.
The changes at the workplace have benefited some workers more than others. The earnings of workers in jobs requiring higher levels of social and analytical skills have risen proportionately more than the earnings of those in jobs requiring higher levels of physical skills. The growing inequity in earnings by skill type is also reflected in the rising inequality in earnings between workers with or without a college education.
The shifting need for skills may have worked to the benefit of women, since they are more likely than men to be employed in occupations needing higher levels of social and analytical skills, whereas men are relatively more engaged in jobs calling for greater physical and manual skills. Because wages have risen faster in jobs requiring higher levels of social and analytical skills, this is likely to have contributed to the shrinking of the gender pay gap from 1980 to 2015.
Determining job skills and preparation
This report analyzes the changing demand for three core families of job skills – social, analytical and physical. Generally speaking, social skills encompass interpersonal skills, written and spoken communications skills, and management or leadership skills. Analytical skills refer to computer and mathematical skills and the importance of critical thinking. Physical skills pertain to the ability to work with machinery or equipment, manipulate tools, and do physical or manual labor.
The source data for the analysis is the Department of Labor’s Occupational Information Network (O*NET), a database covering more than 950 occupations. For each occupation, O*NET contains ratings of detailed skills on a scale measuring their importance to job performance, from one (not important) to five (extremely important). From the scores of skills listed in O*NET, ratings for a representative handful of skills were selected to represent the broader families of social, analytical and physical skills. For example, negotiating and instructing skills are among those chosen to represent social skills. The O*NET ratings for these and related skills are averaged to estimate an overall social skill rating for an occupation. A similar process is repeated to determine the analytical and physical skill rating for a job. Examples of skills chosen to represent analytical abilities are critical thinking and judgment/decision making. Physical abilities are rated based on such skills as handling and moving objects and equipment maintenance.
Ratings for individual occupations are further averaged to obtain an overall rating of the importance of each skill in the American workplace. For example, the average rating of social skills in 2015 was estimated to be 2.96, “important” on the O*NET scale. Thus, occupations with a social skill rating of 2.96 or higher, corresponding to “important,” “very important” or “extremely important,” are classified as requiring higher levels of social skills. Examples of such occupations are chief executives and registered nurses. A similar process is used to separate jobs requiring average or above-average analytical skills (e.g., tax preparers) or physical skills (e.g., welding, soldering and brazing workers) from other jobs. (See a table available for download online for a complete list of occupations and their skill ratings.)
It is important to note that a single job may require high levels of more than one skill. For example, most managers and teachers are typically expected to possess higher levels of both social and analytical skills. Among the 430 occupations analyzed in detail, 206 require average or above-average levels of social skills. Moreover, 180 of these 206 occupations also require a higher level of analytical skills. Thus, there is considerable overlap in the counts of workers in jobs requiring higher levels of social or analytical skills. The overlap is limited between jobs requiring higher levels of physical skills and those requiring higher levels of social or analytical skills.
The preparation required for the performance of a job is also rated on a scale of one to five in O*NET, from little or no preparation needed to extensive preparation needed. The level of preparation depends on a combination of education, experience and other forms of training. The mid-level preparation (rating of three) corresponds to an associate degree or a similar level of vocational training, plus some prior job experience and one to two years of either formal or informal on-the-job training (e.g., electricians). Above-average preparation typically calls for a four-year college degree and additional years of experience and training (e.g., lawyers).
In the midst of a changing workplace, the implicit contract between workers and employers appears to be loosening. The earnings of workers overall have lagged behind gains in labor productivity since the 1970s.10 Moreover, smaller shares of workers receive health or pension benefits in 2015 than they did in 1980. More recently, alternative employment arrangements, such as contract work, on-call work and temporary help agencies, appear to be on the rise.
This chapter focuses on how work has changed for American workers in recent decades. The key issue is the shift in employment opportunities, from jobs requiring physical or manual skills to those requiring social or analytical skills. Related to this is the need for higher levels of education, experience and job training. At the same time, workers must adapt to changes in the broader economic climate. Thus, this section also reports on other key trends in the labor market relating to employment and earnings opportunities, provision of benefits, hours worked, job tenure and work arrangements.
The importance of a given skill to a job is ascertained from the latest ratings in the Department of Labor’s Occupational Information Network (O*NET), a comprehensive database whose ratings are based on surveys of workers combined with information received from job analysts. The ratings information from O*NET is matched to occupations listed in the Current Population Survey (CPS), a monthly survey of approximately 55,000 households conducted jointly by the U.S. Census Bureau and the Bureau of Labor Statistics. The CPS data are then used for the analysis of employment and wage trends in occupations grouped by skill types (see the text box and Methodology for details). The CPS is also the source of the data for most of the remaining analysis.
The changing demand for job skills and preparation
The types of skills needed in the workplace and the level of preparation required to fulfill a job may change over time for two reasons. One possibility is that occupations themselves transform in some fashion, perhaps calling for more computer skills and training over time or using technology to substitute for manual demands. Another possibility is that employment may shift across occupations in response to larger economic and demographic changes. For example, globalization has led to a reduction in the need for manufacturing workers in the U.S., but the aging of the population has increased the need for doctors and nurses.
This chapter focuses on the changing need for job skills and preparation driven by the shift in employment across occupations from 1980 to 2015. Occupations are sorted by importance of a skill type and the level of preparation using the most updated skill ratings in O*NET, principally from within the past decade. These ratings do not change over time. However, employment changes over time and across occupations, driving the overall change in skills and job preparation in the workplace.
The need for job preparation
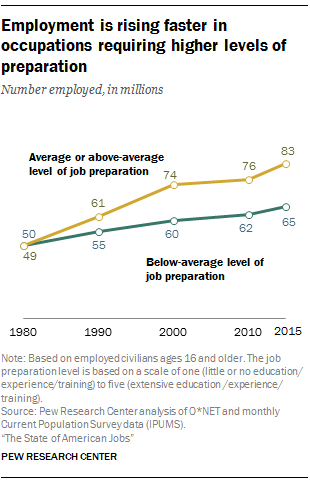
More workers today are in jobs where a higher level of preparation is needed. The number of workers in occupations requiring average to above-average education, training and experience increased from 49 million in 1980 to 83 million in 2015, or by 68%. This was more than double the 31% increase in employment, from 50 to 65 million, in jobs requiring below-average education, training and experience.
As a result, roughly equally divided in 1980, the clear majority of workers in today’s workforce are in jobs calling for significant preparation. At a minimum, these jobs require an associate degree or a similar level of vocational training, plus some prior job experience and one to two years of either formal or informal on-the-job training. (Examples of these occupations range from electricians to lawyers. See the text box for details.)
Within the group of occupations requiring an average to above-average level of preparation, the fastest growth in employment is in jobs that typically require at least a four-year college degree and considerable to extensive training and experience. Employment in these high-skill occupations, including accountants, teachers, surgeons and the like, increased from 22 million in 1980 to 39 million in 2015, or by 80%.
The growing demand for higher-skilled jobs is associated with the overall improvement of the education level of the U.S. population. The share of adults 25 and older with a bachelor’s degree or higher level of education has nearly doubled in the past 35 years, from 17% in 1980 to 33% in 2015.
The rise of social and analytical skills in the labor market
In addition to the level of preparation needed for jobs, the types of skills called for at work are changing. Employment in occupations needing higher levels of social or analytical skills increased significantly from 1980 to 2015, but the demand for higher levels of physical skills has increased only slightly.
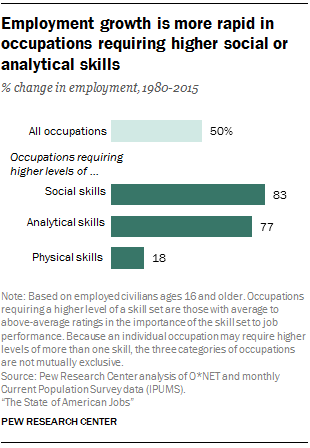
Employment in jobs requiring average or above-average levels of social skills, such as interpersonal, communications or management skills, increased 83% from 1980 to 2015. Meanwhile, employment in jobs requiring higher levels of analytical skills, such as critical thinking and computer use, increased 77%. Examples of jobs needing higher-level social or analytical skills include chief executives, civil engineers, postsecondary teachers and nurses.
In sharp contrast, employment in jobs requiring higher levels of physical skills, machinery operation or tool manipulation, barely budged, increasing only 18%. Jobs calling for higher levels of physical skills include carpenters, welders, and the like. By comparison, overall employment in the economy increased 50% from 1980 to 2015.
In terms of numbers, 90 million workers of a total of 148 million were engaged in jobs requiring higher levels of social skills in 2015. At the same time, 86 million workers were in jobs needing average to above-average analytical skills in 2015. Employment in jobs requiring higher levels of physical skills added up to 57 million.
As noted in more detail in the accompanying text box, there is an overlap in these counts of workers because many jobs call for higher levels of more than one type of skill. For example, managerial or teaching jobs require higher levels of both social and analytical skills. This group of jobs – needing higher levels of both of these skills – is boosting employment by the most in the labor market. More specifically, employment in this select group of jobs increased from 39 million in 1980 to 76 million in 2015, an increase of 94%.
While there is considerable overlap between social and analytical skills, the need for physical skills in combination with social or analytical skills is limited. Most jobs that require higher levels of physical skills, such as carpenters; laundry and dry-cleaning workers; and welding, soldering and brazing workers, do not call for higher levels of social and analytical skills. In 2015, there were 38 million workers employed in jobs requiring only higher levels of physical skills. This number was up only 12% from 1980, when it stood at 34 million.
Employment in jobs requiring higher levels of social or analytical skills is concentrated in more rapidly growing sectors of the economy
Although each sector in the economy creates a diverse array of jobs, some occupations are more likely than others to be found in certain sectors. For example, doctors and nurses are principally in the health care and social assistance sector, while teachers are concentrated in the educational services sector. Similarly, many production workers, such as machinists or tool and die makers, are in manufacturing. For this reason, changes in the economic fortunes of individual sectors are likely to have an influence on the changing needs for skills in the labor market.
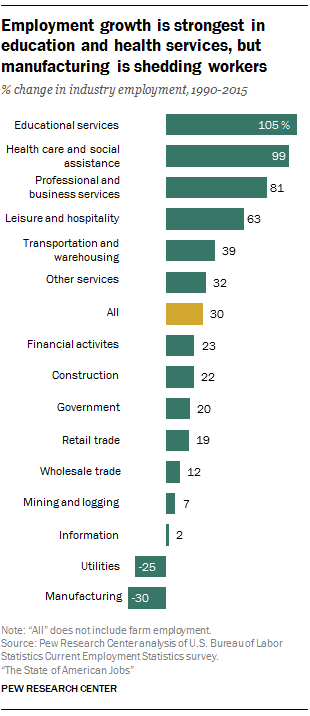
In the past quarter century, there was a sharp divergence in employment growth across industries. From 1990 to 2015, employment doubled in educational services and in health care and social assistance, increasing 105% and 99%, respectively. Employment growth was almost as strong in professional and business services (81%).
Overall, these three rapidly growing sectors combined to hire 20 million more workers from 1990 to 2015, more than half of the total increase of 32 million. More importantly, in 2015, 45% of workers in jobs where social skills are in use at a higher level were employed in these three sectors, as were 44% of workers in occupations requiring higher analytical skills. Thus, the growing importance of social or analytical skills may be linked to the expansion in education, health, and professional and business services.
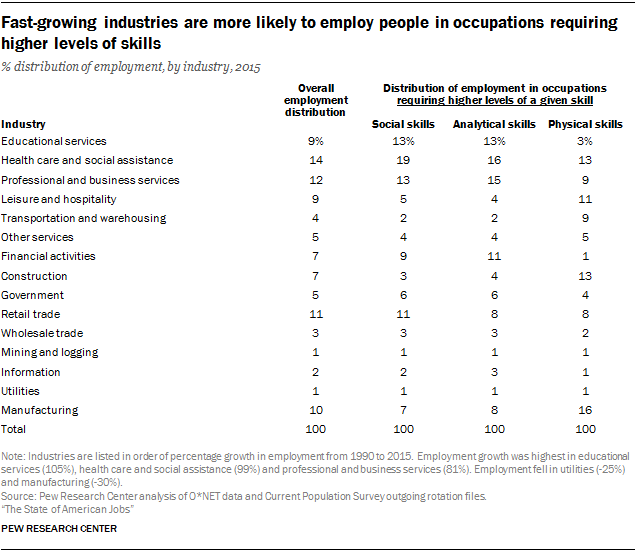
At the same time, the diminishing importance of physical skills in the economy is partly tied to the decline of employment in manufacturing. In 2015, 16% of workers in jobs calling for higher levels of physical skills were in the manufacturing sector, compared with 10% of workers overall. But the manufacturing sector shed nearly one-third of its workforce from 1990 to 2015. Meanwhile, jobs requiring higher levels of physical skills are underrepresented in educational services, health care and social assistance, and professional and business services.11
Wages are increasing faster in jobs that require higher levels of social or analytical skills and higher levels of preparation
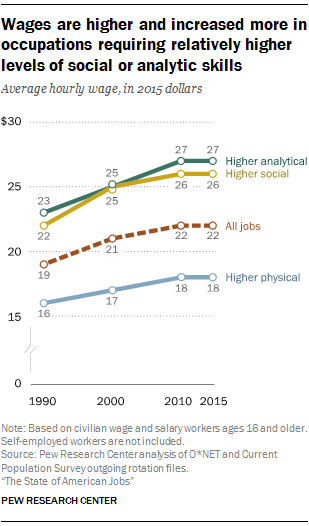
Jobs requiring higher levels of social or analytical skills generally pay more than jobs requiring higher physical skills. From 1990 to 2015, the average earnings in jobs more reliant on social or analytical skills have also increased more than the average earnings in jobs requiring more intensive physical skills. As a result, the earnings gap between jobs requiring higher levels of social or analytical skills on the one hand and physical skills on the other has widened over this period.
In 1990, the average hourly wage of workers in jobs requiring higher analytical skills was $23. This was followed closely by workers in social skill-intensive jobs, who earned $22 per hour. Lagging well behind were workers in physically intensive jobs, who earned $16 per hour, 72% as much as workers in higher analytical skill jobs. (All wages expressed in 2015 dollars.)
From 1990 to 2015, the average hourly wage in jobs requiring higher analytical skills increased the most, rising 19% to $27.12 The average hourly wage in higher social skill jobs increased 15%, to $26. However, wages for workers in higher physical skill jobs were nearly stagnant, increasing only 7% to $18 per hour. Consequently, workers in physically intensive jobs earned only 65% as much as workers in higher analytical skill jobs in 2015.
Women may have benefited more than men from the changing demand for skills
Women are more likely than men to be employed in occupations where social or analytical skills are relatively more important. In light of the wage trends described above, this may have helped narrow the gender wage gap in recent decades.
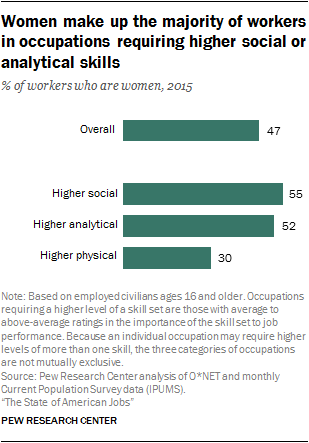
Overall, women made up 47% of the workforce in 2015. But they were the majority of workers in occupations requiring average or above-average levels of social skills (55%) and workers in jobs requiring higher analytical skills (52%). By contrast, women’s employment share in occupations requiring higher levels of physical skills was significantly lower (30%).
Because of the relatively higher wage associated with jobs requiring higher social or analytical skills, women’s overrepresentation in these jobs may have helped narrow the gender wage gap. As shown in a later section in this report, the median annual earnings of full-time, year-round working women increased from $30,402 in 1980 to $40,000 in 2015, a gain of 32%. However, full-time, year-round working men experienced a 3% loss in earnings as their median annual earnings fell from $51,684 in 1980 to $50,000 in 2015. As a result, the wage gap between women and men narrowed from about 60 cents on the dollar in 1980 to 80 cents on the dollar in 2015. (Annual earnings expressed in 2014 dollars.)
A higher level of education is related to the use of social and analytical skills and other forms of job preparation
There is a strong link between workers’ level of education and the odds of their working in jobs that require higher levels of social or analytical skills. Moreover, workers with higher levels of education are more likely to acquire other types of job trainings, acquiring certificates or licenses along the way.
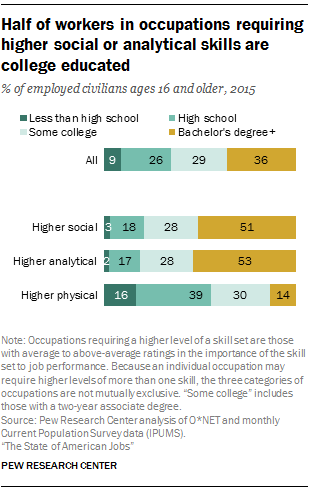
In 2015, among employed workers overall, more than one-third (36%) had completed at least a four-year college degree program. But college-educated workers accounted for about half of employment in occupations requiring higher social skills (51%) or higher analytical skills (53%). Meanwhile, only 14% of workers in jobs requiring higher physical skills were college educated. The education level of a majority of workers in physical-skill jobs was high school or less.
The relationship between college education and skills suggests that the need for college-educated workers may continue to grow in the future. At the same time, new government data reveal that workers with higher levels of education also have higher levels of job preparation in the form of job-related certificates or licenses.
In 2015, one-in-four workers (25%) in the U.S. had a job-related certificate or license, according to new data from the Bureau of Labor Statistics (BLS). The share was highest among the most educated. More than half (52%) of workers with a postgraduate degree had a job certificate or license.13 Similarly, workers with a bachelor’s degree alone (30%) and workers with an associate degree (36%) were more likely than average to have a job-related certificate or license.
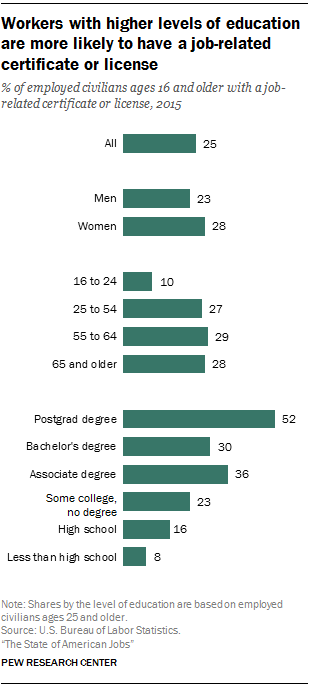
There is also a gender gap in the acquisition of certificates and licenses, but in favor of women. In 2015, women (28%) were more likely than men (23%) to have certificates or licenses. However, there is virtually no difference by age in the likelihood of having a job certificate or license among workers 25 and older.
The relationship among education, gender and job training may be the result of which industries and occupations require certificates and licenses. Indeed, industries and occupations vary greatly on this account. Nearly half the workers (47%) in education and health services have a certificate or license. But only about 10% of workers in retail trade, information, and leisure and hospitality have a certificate or license. By occupation, certification or license rates are highest in health care occupations (77%), legal occupations (68%) and education occupations (56%).
More educated workers and women fared better than others, but employment and earnings prospects overall are little improved
Acquiring new skills and seeking higher levels of job preparation are not the only challenges facing workers today. Two recessions this century, in 2001 and the Great Recession of 2007-09, have set back the employment and earnings potential of many workers by years. Meanwhile, employers have also cut back on the provision of health and pension benefits. Traditional employment arrangements, while still the norm, are showing signs of waning. Alternative work arrangements in the form of contract work, on-call work and temporary help agencies appear to be on the rise. But in the midst of this, women have raised their engagement with the labor market and the gender wage gap has narrowed in recent decades.
Trends in employment
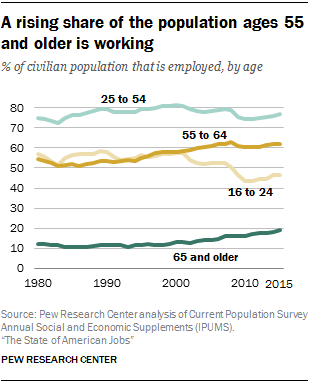
The employment rate in the U.S. – the share of the population 16 and older that is employed – has been relatively steady since 1980. It peaked most recently at 64% in 2000 but returned to its 1980 level (59%) by 2015. The decline in the employment rate since 2000 is linked in part to the aging of the workforce as older workers are less likely to remain in the labor force. Another important factor is the Great Recession (2007-09), which resulted in a sharp contraction in the employment rate, from 63% in 2007 to 58% in 2011.
Even though the overall employment rate is currently the same as in 1980, there are some sharp differences across age groups. Younger workers are much less likely to be working today than they were in 1980, and older workers are laboring on more. Most of this turnaround has happened this century.
Among 16- to 24-year-olds, less than half (46%) were employed in 2015, compared with 57% in 2000. This trend is driven partly by the fact that a larger share of young adults are enrolled in college, which delays their entry into the workforce. Among 18- to 24-year-olds, 40% were enrolled in college in 2014, compared with 26% in 1980.
At the other end of the age spectrum, older adults are staying in the workforce longer than they used to and their employment rate is climbing as a result. The share of adults 65 and older who are employed has risen steadily in recent decades, climbing from 12% in 1980 to 19% in 2015. The increase was uninterrupted by the Great Recession. The employment rate for adults ages 55 to 64 has also risen since 1980, but its level in 2015 (62%) was less than its peak in 2008 (63%).14
Women, too, have greatly increased their presence in the workforce in the past several decades. Some 48% of women 16 and older were employed in 1980, and this share increased to 58% by 2000. During the same period, the employment rate for men held steady at about 70%. Since 2000, the employment rate has fallen for both men and women, although men have experienced a slightly steeper decline. For men, the employment rate fell from 71% in 2000 to 65% in 2015, or 6 percentage points. During the same period, the employment rate for women decreased from 58% to 54%, a drop of 4 percentage points.
Earnings of full-time, year-round workers are fairly flat since 198015
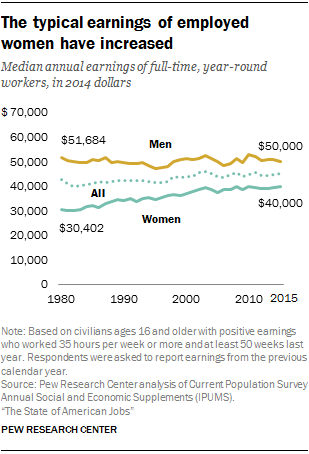
American workers overall have not received much of a pay raise from 1980 to 2015. But there is a sharp difference in the outcomes for men and women during this time – the earnings of men have fallen, and the earnings of women have risen. Workers with a four-year college degree and older workers have also fared better than others.
After adjusting for inflation, the median earnings for all full-time, year-round workers increased only 6% from 1980 to 2015, from $42,563 to $45,000 (in 2014 dollars).16 Women, however, experienced a 32% gain in median earnings from 1980 to 2015. In sharp contrast, men experienced a 3% loss in earnings. As a result, the wage gap between women and men has narrowed from about 60 cents on the dollar in 1980 to 80 cents on the dollar in 2015.
Along education lines, workers with a four-year college or higher level of education are the only group to experience a gain in median earnings since 1980. The median earning of a college-educated worker increased 11% from 1980 to 2015 ($57,764 to $64,000). Meanwhile, the median earnings of workers with lesser education decreased, with the greatest loss experienced by workers who did not complete high school. The median for these workers fell from $33,442 in 1980 to $25,000 in 2015, a loss of 25%.
Younger workers are earning significantly less than they did in 1980, but the earnings of older workers have risen. Among full-time, year-round workers, the median earnings of 16- to 24-year-olds decreased from $28,131 in 1980 to $25,000 in 2015, a drop of 11%. Meanwhile, the median earnings of workers 65 and older rose 37%, from $36,483 in 1980 to $50,000 in 2015. Workers ages 55 to 64 earned 10% more in 2015 than they did in 1980. The median earnings of workers ages 25 to 54 have remained flat at around $45,000. Full-time, year-round workers ages 65 and older used to earn less than their prime-age peers (ages 25 to 54), but now their earnings match those of workers ages 55 to 64 and they are among the ranks of the nation’s highest paid workers.
A smaller share of workers are covered by employer-provided benefits17
As earnings overall barely inched up, employee benefits – judged by the share of workers covered by employer-sponsored health insurance or retirement plans – have eroded since 1980. Only older workers, 55 and older, and, to some extent, workers with a four-year college degree or higher level of education have bucked this trend. But even as the coverage of workers has slipped, benefit costs have assumed a larger share of employee compensation due, in part, to the rising cost of health insurance plans.
Health insurance benefits
As of 2013, employer-sponsored health insurance plans cover a smaller share of workers than they did in 1980. Most workers get health insurance coverage either through their own employer or the employer of a family member, such as a spouse or parent. The share of workers with any employer-sponsored health insurance plan (either through their own employers or through the employer of a family member) fell from 77% in 1980 to 69% in 2013. The share of workers covered by a health insurance plan through their own employer dropped from 62% in 1980 to 51% in 2013.
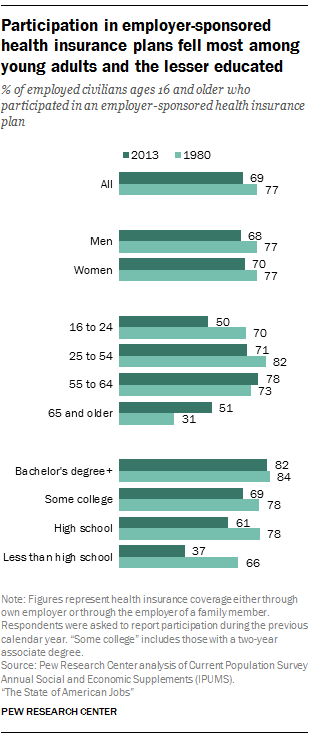
Among demographic groups, participation in an employer-sponsored health plan diminished similarly among men and women, from 77% for both in 1980 to 68% for men in 2013 and 70% for women.
The youngest workers (ages 16 to 24) experienced the sharpest decline in employer-sponsored health insurance coverage. Seven-in-ten young workers in 1980 had health insurance either though their own employer or through the employer of a family member, but only half of today’s young workers do. The coverage for workers ages 25 to 54 dropped from 82% to 71%. However, older workers, especially those ages 65 and older, are much more likely to get insurance through an employer than they were several decades ago. The share of workers ages 65 and older with employer-sponsored health insurance increased from 31% to 51%.
Across education groups, workers with a bachelor’s degree or higher level of education are the only group that did not experience much of a decline in health insurance coverage received through employers. Coverage fell among all other education groups. The sharpest drop was among workers with less than a high school education, as the share of these workers with an employer-sponsored health plan fell from 66% in 1980 to 37% in 2013.
Retirement benefits
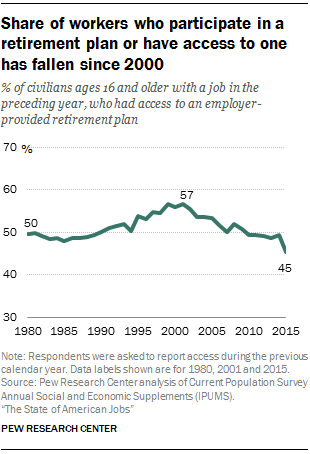
In contrast to the long-run decline in health insurance benefits, the decrease in retirement benefits is of more recent origin. The share of workers with access to an employer-sponsored retirement plan, whether a traditional pension or a 401(k)-type plan, peaked most recently at 57% in 2001, up from 50% in 1980.18 However, the share fell to 45% by 2015.
Changes in retirement plan access also vary across demographic groups, with older workers and women faring better than other groups. In 1980, only 25% of workers 65 and older had access to an employer-sponsored retirement plan, but the share increased to 40% in 2015. Overall, retirement benefits are most commonly available to workers in their prime working years. In 2015, the share of workers in a retirement plan or with access to one ranged from 51% among 55- to 64-year-olds to 30% among 16- to 24-year-olds.
The share of employed men with access to a retirement plan decreased from 53% in 1980 to 44% in 2015. At the same time, the share among employed women edged up from 45% to 46%. Thus, women now are more likely than men to have access to a retirement plan.19
Although a smaller share of workers today are covered in employer-sponsored health or retirement plans, the employers’ cost of providing these benefits has risen over time. This is reflected in the share of benefits in a worker’s total compensation. The average hourly compensation of employees in June 2016 was $34.05, according to the U.S. Bureau of Labor Statistics. Of this, $23.35, or 69%, went to wages and $10.70, or 31%, went to benefits. A quarter century earlier, in 1991, 72% of compensation went to wages and 28% to benefits. The increase in benefit costs derives principally from an increase in insurance benefits (including health insurance). The insurance share in employee compensation is up from 7% in 1991 to 9% in 2016. There is also an increase in the share of retirement benefits, from 4% to 5%.
Workers today stay longer with their employer
Job tenure, measured by how long workers have been with their current employer, has increased in the past three decades. Most of this increase occurred since 2000. In part, this is due to the rising share of older workers in the labor force. These workers tend to have a much longer tenure with their employer. But the economic downturns this century, such as the Great Recession, may also have been a factor, making it harder for workers to switch jobs.
The median job tenure for all workers was 4.6 years in 2014, up from 3.5 years in 1983. The increase was greater among women (from 3.1 years in 1983 to 4.5 years in 2014) than among men (from 4.1 years to 4.7 years over the same period). Thus, working women now stay with their employer almost as long as their male counterparts do.
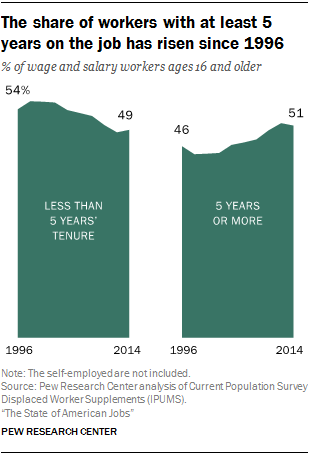
Looked at another way, about half of workers (51%) had worked for their current employer five years or longer in 2014, compared with 46% of workers in 1996. Meanwhile, the share of workers who stay with their current employer for one year or less dropped from 26% to 21%.
Older workers tend to have been with their current employer longer than younger workers. In 2012, workers 55 and older had a median tenure greater than 10 years, compared with about 3 years for 25 to 34-year-old workers. The job tenure of specific age groups has not changed much since 1996, with the exception of older workers. The share of workers 65 and older who were with the same employer for five years or more went up from 67% in 1996 to 76% in 2014, and the share among workers ages 55 to 64 increased from 71% to 75%.
Workers with higher education do not have more job tenure than their lesser-educated counterparts. Among workers 25 and older, those with at least a bachelor’s degree had a median job tenure of 5.6 years in 2014, compared with 5.8 years for those with only a high school diploma. Workers with less than a high school education have the shortest tenure among all education groups (4.4 years in 2014), and their median tenure has been flat since 1996.
Americans are working more overall20
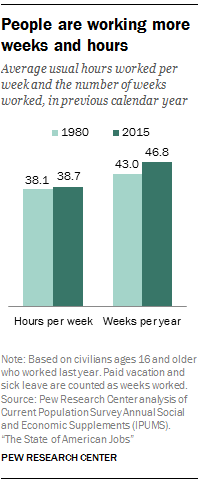
Americans may not be employed in greater shares and their earnings may have risen only modestly, but they are putting in more time at work today than they did in 1980. Most notably, workers are putting in an average of nearly four more weeks of work annually, with the average climbing from 43 weeks in 1980 to 46.8 weeks in 2015 (weeks at work include paid vacation and sick leave). The average length of a typical workweek is also up, increasing to 38.7 hours in 2015 from 38.1 hours in 1980.21 Overall, this adds up to an additional one month’s worth of work.
This change is largely driven by the increasing hours and weeks that women devote to the labor market. With respect to hours at work, the average amount of time per week by employed women increased from 34.1 hours in 1980 to 36.2 hours in 2015, while the average for men was unchanged at about 41 hours.
Employed women also significantly increased the weeks they worked on a yearly basis. The average number of weeks worked by working women was 46.2 in 2015, compared with 40.2 in 1980. Weeks worked increased by less among employed men, rising from 45.2 in 1980 to 47.4 in 2015. As a result, employed women now work nearly as many weeks annually on average as men.
Another factor contributing to the growing trend is the sharp increase of work hours among workers 65 and older. The average for workers in this age group increased from 29.3 hours per week in 1980 to 33.7 in 2015. Over the same period, workers 65 and older also raised the annual number of weeks worked from 38.3 to 44.6.
Alternative employment arrangements may be on the rise, but fewer workers are self-employed or working multiple jobs
The emergence of services sourced through Uber, Mechanical Turk, Airbnb and other online platforms has given rise to debates about whether the workers providing those services are employees or contractors and whether they receive the basic workplace protections and benefits as under conventional work arrangements. Similar concerns surround companies’ use of contract or temporary workers in lieu of adding workers directly to their payrolls. Although there is evidence that alternative work arrangements are becoming more prevalent, principally driven by the rise of contract work and independent contractors, the emergence of a sizable online economy where many workers rely on employment and compensation from “gigs” seems to be some distance away.
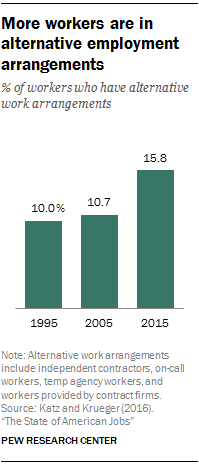
“Alternative employment arrangements” refers to the hiring of workers who are independent contractors or sourced through contract firms, on-call workers, or temporary-help agency workers. The Bureau of Labor Statistics first estimated the share of these workers in overall employment in 1995. At that time 10.0% of employed workers were in alternative employment arrangements. This share held steady in the following decade, edging up to 10.7% in 2005. More recently, independent researchers who replicated the government’s survey found that the share of workers in alternative work arrangements had risen to 15.8% in 2015. Thus, about 24 million workers currently work in these arrangements.
The majority of workers with alternative employment arrangements are independent contractors, and their share of the workforce rose from 6.3% in 1995 to 8.4% in 2015. The share of contract workers – those hired by a contract company and sent to the customer’s worksite – jumped from 1.3% in 1995 to 3.1% in 2015. They are now the second-largest group of workers with alternative work arrangements.
The online, or gig, economy appears still to be in its infancy, at least as measured by its engagement of workers. According to Katz and Krueger (2016), only 0.5% of all workers provided services through online intermediaries such as Uber in 2015. Another estimate from JPMorgan Chase Institute finds that 1% of adults earned income from work provided through online platforms in any given month from 2012 to 2015.
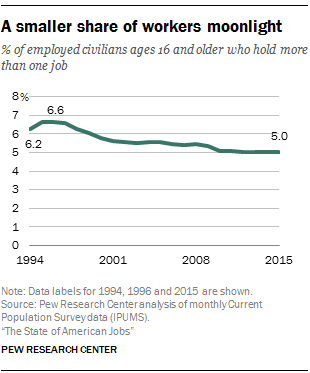
The emergence of the gig worker also fails to materialize in other labor market indicators. The share of workers who moonlight by working more than one job is on the way down, falling from more than 6% in the mid-1990s to 5% in 2015. Almost all of this decrease had transpired by 2000, perhaps driven by the economic boom in the 1990s, which may have reduced the need to moonlight. But the rate has shown no signs of inching up in recent years.
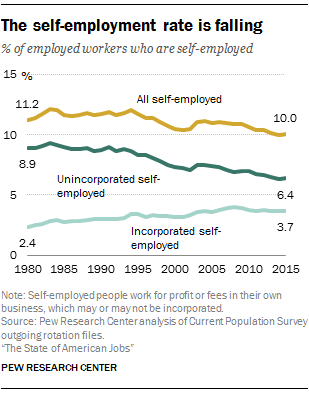
An increase in self-employment is another potential indicator of engagement in the gig economy. But the self-employment rate is also on the decline, falling from 11.2% in 1980 to 10.0% in 2015. The decrease is entirely due to the falling share of self-employed workers who have not incorporated their businesses, those more likely to be out on their own.22


