As the U.S. has transformed rapidly to an information-based economy, employment in science, technology, engineering and math occupations has grown – outpacing overall job growth. Since 1990, STEM employment has grown 79% (9.7 million to 17.3 million) and computer jobs have seen a whopping 338% increase over the same period.
Using a broad definition of the STEM workforce, women make up half (50%) of all U.S. workers in STEM occupations, though their presence varies widely across occupational clusters and educational levels. Women account for the majority of healthcare practitioners and technicians but are underrepresented in several other STEM occupational clusters, particularly in computer jobs and engineering.
While there has been significant progress for women in the life and physical sciences since 1990, the share of women has been roughly stable in other STEM occupational clusters and has actually gone down 7 percentage points in the area with the largest job growth over this period: computer occupations, a job cluster that includes computer scientists, systems analysts, software developers, information systems managers and programmers.
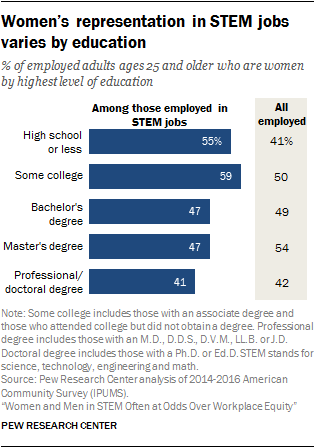
Gains in women’s representation in STEM jobs have been concentrated among women holding advanced degrees, although women still tend to be underrepresented among such workers.
Black and Hispanic workers continue to be underrepresented in the STEM workforce. Blacks make up 11% of the U.S. workforce overall but represent 9% of STEM workers, while Hispanics comprise 16% of the U.S. workforce but only 7% of all STEM workers. And among employed adults with a bachelor’s degree or higher, blacks are just 7% and Hispanics are 6% of the STEM workforce.
Asians are overrepresented in the STEM workforce, relative to their overall share of the workforce, especially among college-educated workers: 17% of college-educated STEM workers are Asian, compared with 10% of all workers with a college degree.
The representation of women, blacks and Hispanics holds pocketbook implications for workers. STEM jobs have relatively high earnings compared with many non-STEM jobs, and the earnings gap persists even after controlling for educational attainment. Among workers with similar education, STEM workers earn significantly more, on average, than non-STEM workers.
In spite of the earnings advantage that STEM workers have over non-STEM workers, the gender wage gap is wider in STEM occupations than in non-STEM jobs. This is partially because women are clustered in lower-paying STEM jobs in the health care industry and underrepresented in the more lucrative fields of engineering and computer science. The pattern is similar for blacks and Hispanics, who also tend to be concentrated in less lucrative STEM jobs, widening the measured earnings disparity.
One potential barrier for those wishing to enter the STEM workforce is the generally higher level of educational attainment required for such positions. Among college-educated workers, one-in-three (33%) majored in a STEM field. But only about half (52%) of those with college training in a STEM field are currently employed in a STEM job.
The reasons about half of college-educated workers with STEM-related training turn to jobs elsewhere are likely complicated. Some may have found their skills and training to be applicable to and rewarded in a non-STEM occupation (such as banking or finance). But for others, there may be barriers to entry into STEM jobs in addition to obtaining a bachelor’s degree in a STEM field.
Even so, among college-educated workers, women who majored in computer science or related computer fields are less likely than men trained in those fields to be working in computer jobs. Similarly, women who majored in engineering are less likely than men to be working in engineering jobs. Thus, in two occupational clusters with particularly low shares of women, retention of those who appear to meet a key requirement for job entry appears to be lower for women than for men.
Defining STEM workers with a wide-angle lens
This analysis uses a broad definition of the STEM workforce and is based solely on occupation, as classified in the U.S. Census Bureau’s American Community Survey. As defined, here, the STEM workforce includes 74 occupations including computer and mathematical occupations, engineers and architects, physical scientists, life scientists, and health-related jobs such as healthcare practitioners and technicians (but not health care support workers such as nursing aides and medical assistants). As such, it includes workers with associate degrees and other credentials as well as those with bachelor’s and advanced degrees.
There is no standard definition of STEM workers. Other analyses of STEM workers include somewhat different occupations (see, for example, the Economics and Statistics Administration of the U.S. Department of Commerce). The National Center for Science and Engineering Statistics focuses on those with a college degree or more education in their surveys; UNESCO studies on global diversity issues in STEM focus even more narrowly on researchers with advanced degrees working in STEM.
Including healthcare practitioners and technicians as STEM occupations has broad ramifications for the key findings. There are 9.0 million health-related jobs, comprising 52% of the STEM workforce. Healthcare practitioners and technicians are largely women, thus their inclusion boosts the overall representation of women in the STEM workforce. These health-related occupations also have somewhat larger shares of black workers and smaller shares of Asian workers compared with other STEM occupations, which affects the racial and ethnic composition of the overall STEM workforce. Among college-educated workers who majored in a STEM field during their undergraduate education, those who majored in health professions are significantly more likely to work in a STEM occupation, so their inclusion increases figures on the retention of STEM-trained workers.
Social scientists are not included as a STEM occupation in this study, although other studies sometimes classify social sciences as a STEM job. As a practical matter, doing so makes little difference in the overall portrait of the STEM workforce because less than 1% of the workforce (about 280,000 workers in 2016) are classified as social scientists based on the Standard Occupational Classification system. See the sidebar for more on the characteristics of social scientists in the workforce.
The Census data used do not identify the subject matter expertise for postsecondary teachers, therefore, these workers are not included in the STEM workforce. As a practical matter, this omission does not appear to change the overall portrait of STEM workers, as others estimate that only 1% of those who majored in a STEM field are in academic jobs in colleges and universities. See the Appendix for characteristics of those in postsecondary teaching occupations.
The STEM workforce is growing, particularly for computer jobs
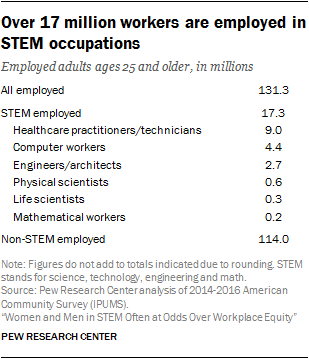
As of 2016, 17.3 million workers ages 25 and older were employed in STEM occupations, comprising 13% of the 131.3 million total U.S. workforce. About half of STEM workers (52%, 9.0 million) are employed as health care practitioners and technicians, a group that includes nurses, physicians and surgeons, as well as medical and health services managers. The next largest STEM occupational clusters are computer workers (25%, 4.4 million employed) and engineers and architects (16%, 2.7 million employed).
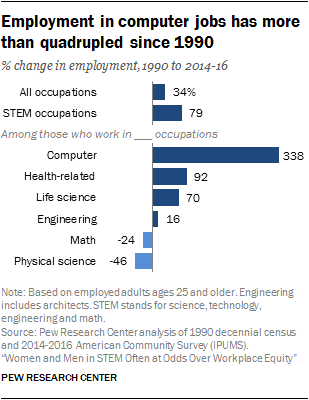
Growth of employment in STEM has markedly outpaced the growth of overall employment. Since 1990 STEM employment has grown 79% (from 9.7 million to 17.3 million), whereas overall employment grew only 34%. Some STEM occupations have grown more than others. Driven by the proliferation of information technology industries and the growth of the health care sector, computer workers have more than quadrupled since 1990 (a 338% increase) and healthcare practitioners and technicians have nearly doubled (a 92% increase). Employment of engineers and architects has grown only 16%, while employment of physical scientists has fallen by 46% from the 1990 level (from 1.1 million in 1990 to 0.6 million today) and math jobs have fallen by 24%.14
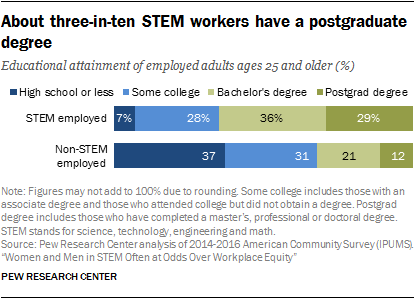
STEM workers tend to have relatively high levels of education compared with other workers. Overall, they are about twice as likely as those in non-STEM occupations to have earned at least a bachelor’s degree (65% vs. 32%). Roughly three-in-ten STEM workers (29%) have earned a master’s, doctorate or professional degree, far exceeding the share of non-STEM workers with advanced degrees (12%). Some 36% of STEM workers have a bachelor’s degree (but no postgraduate degree) compared with 21% of non-STEM workers. Among STEM workers, life scientists are the most highly educated on average; 54% of these workers have an advanced degree.
About three-in-ten STEM workers report having completed an associate degree (15%) or some college with no degree (14%). These workers are more prevalent among healthcare practitioners and technicians, computer workers and engineers. See the sidebar in Chapter 6 for survey findings on “middle-skills” workers with an associate degree or some college education.15
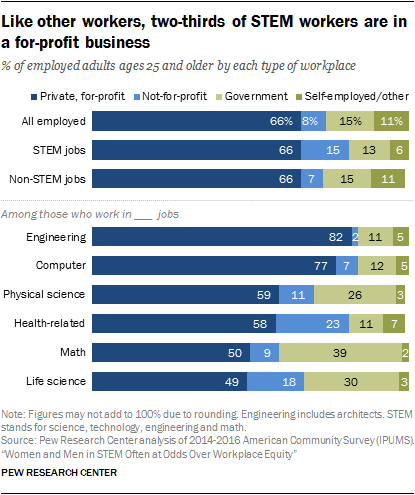
Most STEM workers work for a private, for-profit employer. The share – 66% – is substantively identical to the share of all employed adults.16 Engineers and architects (82%) and computer workers (77%) are among the most likely to work for a private employer. Fewer healthcare practitioners and technicians work in the private, for-profit sector (58%); almost a quarter of these workers (23%) work for a not-for-profit employer.
STEM workers are much less likely to be self-employed than other workers – 6% of STEM workers are self-employed compared with 11% of non-STEM workers. (Workers in social science occupations and postsecondary education jobs, by contrast, are more likely to work in government and non-profit organizations.)17 See Appendix for details.
Diversity of the STEM workforce ranges widely within and across job clusters

Although women have made gains in representation in the STEM workforce over the past roughly 25 years, particularly in life and physical science jobs, they remain strongly underrepresented in some STEM job clusters, notably computer jobs and engineering.
Racial and ethnic diversity in STEM is also varied. Black and Hispanic workers remain underrepresented overall; these groups are also underrepresented among those in STEM jobs with professional or doctoral degrees.18
Asians are overrepresented across all STEM occupational clusters and have an especially large presence in the college-educated STEM workforce, particularly in computer occupations, relative to their share among employed college graduates overall.
Women overrepresented in healthcare professions, underrepresented in engineering and computer science
Women comprise 47% of all employed adults today, up modestly from 45% in 1990, and they make up half (50%) of all employed adults in STEM jobs in the U.S. The share of women in STEM overall is driven in large part by women’s overrepresentation in health-related jobs, the largest STEM occupational cluster. Three-quarters (75%) of healthcare practitioners and technicians are women.
Women’s representation in STEM occupations varies substantially by occupational subgroup. Engineering occupations have the lowest share of women at 14%. Computer occupations follow, with women comprising a quarter of workers (25%) in these fields. Women are underrepresented among physical scientists (39%), but their representation among life scientists (47%) and math workers (46%) roughly equals women’s overall share in the workforce (47%).
Since 1990 women have made large gains in some STEM occupations, but in others growth has been far slower or has even reversed. In fact, the share of women has decreased in one of the highest-paying and fastest-growing STEM clusters – computer occupations. In 2016, 25% of workers in these occupations were women, down from 32% in 1990. At the same time, growth in women’s representation in engineering has been incremental at best, increasing only slightly from 12% in 1990 and 2000 to 14% today. Women’s shares among life and physical scientists, however, climbed markedly over this period (13 and 17 percentage points, respectively).
Women’s representation among the college-educated STEM workforce depends, in part, on women completing college training in STEM fields. Among college-educated workers, the share of women earning a STEM degree varies widely and generally corresponds with the share of women in these occupational clusters. Among all college-educated workers who majored in a health professions field, 81% are female. But just 16% of college-educated workers who majored in engineering are women.
Within occupational subgroups, there is often broad variation among occupations in their share of women. The report’s Appendix presents the share of women and total number of workers in specific STEM occupations. Mechanical engineering and electrical engineering have some of the lowest shares of women of any engineering occupation, or any STEM occupation (8% and 9%, respectively). By comparison, environmental engineering, architecture and industrial engineering have somewhat larger shares of women (29%, 26% and 21%, respectively).
Similarly, levels of women’s representation vary enormously among health-related occupations. About nine-in-ten nurses (89%) and virtually all dental hygienists (95%) are women.19 Women’s representation among the ranks of physicians and surgeons is up from 20% in 1990 and 26% in 2000, coinciding with women’s increases in medical school enrollment and graduation over this period. But, just 36% of physicians and surgeons today and 30% of dentists are women despite notable gains over time.
For their part, men who work in STEM occupations are concentrated in computer occupations followed by engineering and health-related occupations. Among male STEM workers, 38% work in computer jobs and 27% each work in engineering/architecture and health-related jobs. Women in STEM jobs are concentrated in health-related occupations; 77% of female STEM workers are employed as healthcare practitioners and technicians.
On average, women’s representation in STEM jobs is lower among those employed with advanced degrees. For example, among all STEM workers holding a professional or doctoral degree, about four-in-ten are women (41%), compared with about six-in-ten (59%) STEM workers holding an associate degree or with some college experience but no degree.

Social sciences are a popular college major but comprise a small occupational group
About 5.8 million (or 12%) of today’s college-educated workers majored in the social sciences. Psychology majors comprise the single largest group of those who majored in a social science field (35%). The next most popular social science majors are political science (19%) and economics (16%).
Very few workers (3%) who majored in the social sciences are employed as social scientists (based on the Standard Occupational Classification system). The majority work in the cluster of social services, legal and education (30%) or in management, business and finance occupations (26%). Another 12% of social science majors are employed in a STEM occupation.
Those in social science occupations are far more likely to be college-educated than workers in other occupational clusters: 97% of those in social science jobs have completed at least a bachelor’s degree, and 82% have finished an advanced degree (a third hold a doctoral degree). Of the roughly 280,000 workers employed as social scientists in 2016, 80% were white, 8% were Hispanic, 5% were black and 5% were Asian. Women currently make up 63% of social scientists, up from 54% in 2000 and 50% in 1990. Among college-educated workers who majored in the social sciences, 54% are women.
This pattern generally holds within occupational clusters as well. Among healthcare practitioners and technicians with a master’s degree or less, roughly eight-in-ten are women. By contrast, among health-related workers with a professional or doctoral degree, 45% are women. See Appendix for details by occupation.
At the same time, the biggest growth in women’s representation since 1990 has been among STEM workers with advanced degrees, doctoral degrees in particular; this aligns with women’s broader gains in educational attainment during this period. The share of women among doctoral or professional degree holders in the overall STEM workforce has climbed from 27% in 1990 to 41% today. The share of women among STEM workers with a bachelor’s degree (but no advanced degree) has ticked up from 43% in 1990 to 47%, on par with the overall share of women in the workforce (47%).
Hispanics and blacks are underrepresented, Asians and whites are overrepresented in most STEM occupations
The majority of STEM workers in the U.S. are white (69%), followed by Asians (13%), blacks (9%) and Hispanics (7%). Compared with their shares in the overall workforce whites and Asians are overrepresented; blacks and Hispanics are underrepresented in the STEM workforce as a whole.
Over the past 25 years the STEM workforce has become more racially and ethnically diverse, echoing increasing diversity in the workforce during that period. In 1990, 83% of STEM workers were white, 6% were Asian, 7% were black and 4% were Hispanic.
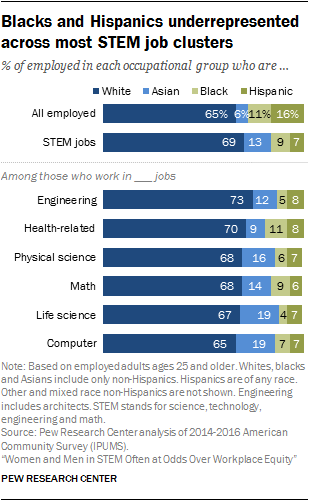
Within occupational clusters, the share of workers who are black or Hispanic varies widely (see Appendix).20
Health technician and nursing jobs have some of the largest shares of black or Hispanic workers. For example, 37% of licensed practical and licensed vocational nurses are either black or Hispanic, as are a quarter or more of health support technicians (27%), medical records and health information technicians (25%), and clinical laboratory technologists and technicians (25%). Among registered nurses, 17% are black or Hispanic. By comparison, other health-related jobs have smaller shares of workers who are black or Hispanic including physicians and surgeons (11%), pharmacists (10%), dentists (9%), and physical therapists (9%). Just 5% of optometrists, veterinarians and chiropractors are black or Hispanic.
In the physical sciences, blacks and Hispanics together comprise 22% of chemical technicians but only 14% of chemists and materials scientists, 10% of atmospheric and space scientists, 7% of environmental scientists and 6% of astronomers and physicists. Among mathematical workers, 19% of operations research analysts are black or Hispanic, compared with just 5% of actuaries.
Whites are overrepresented among STEM workers relative to their share in the total workforce. Asians (including both men and women) are also overrepresented among STEM workers compared with their share in the total workforce, particularly among STEM workers with a postgraduate degree. For details, see Appendix.
Asians are overrepresented across all STEM occupational groups with higher than average shares among computer workers and life scientists, accounting for 19% of workers in both of these fields, which is much higher than their share in the workforce overall (6%).
The share of Asians in STEM jobs varies substantially within occupational groups, however. For example, in engineering jobs the share of Asians ranges from 30% among computer hardware engineers to 2% among surveying and mapping technicians. Among healthcare practitioners and technicians, about one-in-five physicians and surgeons (21%) are Asian. But Asians comprise a far smaller share of veterinarians (3%) and emergency medical technicians and paramedics (2%).
About one-in-five (19%) STEM workers in the U.S. are foreign born, broadly similar to the share in the overall workforce (18%). The vast majority of the Asian STEM workforce is foreign born (82%) as is the Asian workforce overall in the U.S. (81%). Black STEM workers, however, are more likely to be foreign born than black workers overall (22% vs. 14%). Hispanics working in STEM jobs are far less likely than those in the workforce overall to be foreign born (32% of Hispanic STEM workers are foreign born, compared with 54% of all employed Hispanics ages 25 and older).
Earnings of STEM workers outpace those in other kinds of jobs

The typical STEM worker earns significantly more, on average, than the typical worker in a non-STEM occupation, and the earnings gap has been widening since 1990. The wage gap between STEM and non-STEM workers persists even when controlling for educational attainment.
Among full-time, year-round workers ages 25 and older, median earnings for STEM occupations were $71,000 in 2016.21 Comparable earnings for non-STEM workers were $43,000. Thus, STEM workers typically earn about two-thirds more than those in non-STEM jobs.22
After adjusting for inflation, the typical earnings of STEM workers have increased since 1990, while earnings among non-STEM workers have been relatively flat.23
Earnings vary significantly among STEM workers. Computer workers, mathematical workers and engineers/architects have median earnings between $81,100 and $83,000. In contrast, full-time, year-round healthcare practitioners and technicians have the lowest median earnings at $61,000.
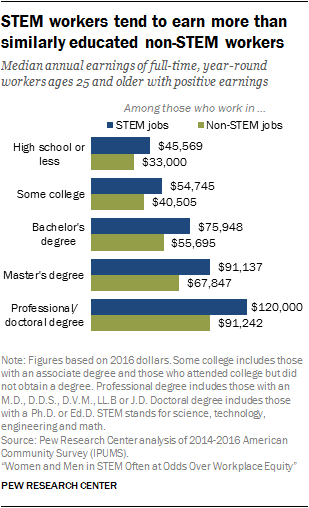
Even among workers with similar levels of education, STEM workers earn significantly more than non-STEM workers. For example, among those with some college education (including those with an associate but not a bachelor’s degree), the typical full-time, year-round STEM worker earns $54,745. A similar non-STEM worker earns $40,505, 26% less.
Women in STEM occupations tend to be paid less than men working in STEM. Median earnings for full-time, year-round women working in a STEM job were $60,828 in 2016 – 72% as much as the median earnings of men working in STEM occupations ($84,000). The earnings gap between women and men is larger in the STEM workforce than it is among non-STEM occupations. Among non-STEM workers, women’s median earnings are 79% of men’s earnings.
In spite of the larger gender pay disparity among STEM workers, women working in STEM tend to be paid significantly more than women working in non-STEM occupations overall. The median earnings for women working full-time, year-round in non-STEM occupations are only $38,480.
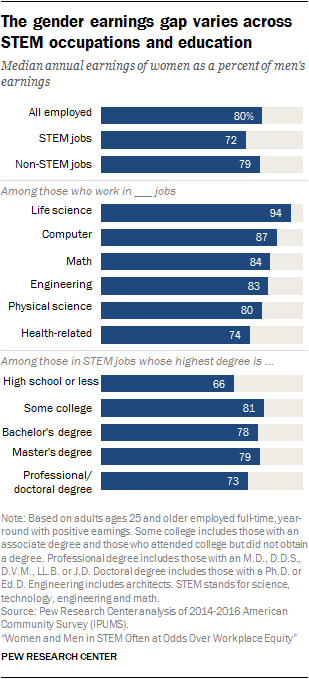
The 72% gender earnings gap overall partly reflects that men and women in the STEM workforce tend to work in different occupational subgroups. Compared with women, a higher share of men in STEM jobs are in higher-paying computer or engineering/architecture jobs. Women are more likely than men to be in lower-paying healthcare practitioner and technician positions.24
Among full-time, year-round workers, the gender earnings gap varies across specific STEM occupational subgroups. For example, among computer workers, the typical woman earns 87% as much as the typical man. Among engineers and architects the gender earnings gap is 83%. However, the gender earnings gap among healthcare practitioners and technicians is 74%.25
The overall gender earnings gap in the STEM workforce has not changed over the past 25 years. In 1990 the median earnings of women in STEM was 72% of the median earnings of men in STEM.
The gender pay gap is widest for STEM workers with professional or doctoral degrees (women’s median annual pay is 73% of men’s) and those with high school or less education (66%).
Racial earnings gaps are substantial but narrow among similarly educated and trained STEM workers
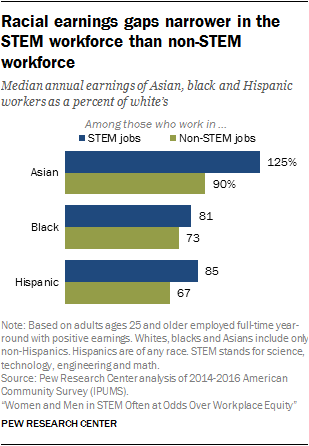
The median earnings of blacks ($58,000) and Hispanics ($60,758) working in STEM occupations are less than those of whites ($71,897) and Asians ($90,000) in the STEM workforce. The black to white earnings gap among STEM workers, while substantial, is smaller than the racial earnings gap among the non-STEM workforce. The typical black STEM worker earns 81% as much as the typical white STEM worker; blacks in non-STEM occupations earn 73% as much as their white counterparts.26
Similarly, the earnings disparity between Hispanic and white STEM workers (85%) is narrower than among non-STEM workers (67%).
In the STEM workforce, the typical Asian is paid substantially more than their white counterparts (125%) although Asians working in non-STEM occupations tend be paid less than whites (90%). As shown later in this chapter, this pay advantage narrows considerably once STEM-training is taken into account.
Across all of these racial and ethnic groups, women earn less than their male counterparts (see Appendix).
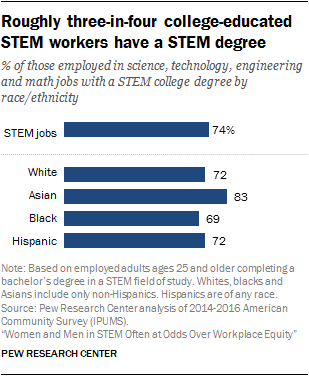
Among college-educated workers in STEM occupations, Asians are the most likely to have a STEM bachelor’s degree (83% do).27 Smaller shares of college-educated Hispanics (72%), whites (72%) or blacks (69%) in STEM occupations majored in a STEM field.
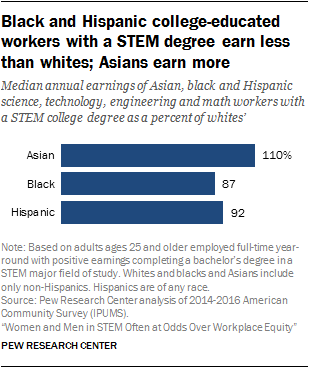
STEM training narrows the earnings gap for blacks and Hispanics working in STEM occupations. Among college-educated workers who majored in and are in the STEM workforce, blacks earn 87% of whites and Hispanics earn 92% of whites. College-educated Asians in STEM occupations who have been trained in STEM earn about 110% of similarly educated whites in STEM. These gaps are narrower than the simple earnings gaps presented earlier without regard to the education or training of the STEM workers.
Value of STEM training among college-educated workers
Among workers ages 25 and older with at least a bachelor’s degree, one-in-three (33%) has an undergraduate degree in a STEM major field of study.28 The largest STEM-educated group is those who majored in engineering at 4.7 million workers. Some 3.9 million college-educated workers have health professions degrees, while 3.1 million have degrees in life or biological sciences. Fewer majored in computer science or related fields (1.8 million) or physical or earth sciences (1.7 million).
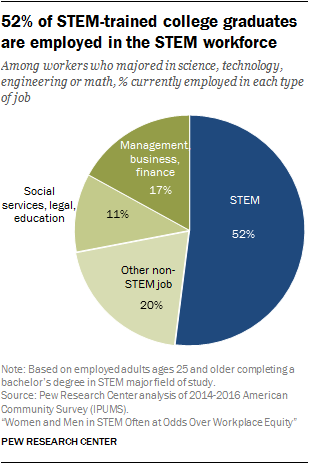
Not all of these STEM-trained workers are employed in a STEM occupation, however. In fact, only about half of them are (52%). The rest are working in other fields with many still benefitting from the financial bump that comes with a STEM degree.29
Retention rates vary among the STEM college majors. Workers who majored in a health professions field (for example, nursing or pharmacy) are the most likely to work in STEM jobs (70% do). In contrast, workers with degrees in mathematics and statistics are the least likely (31%) to be employed in a STEM occupation.
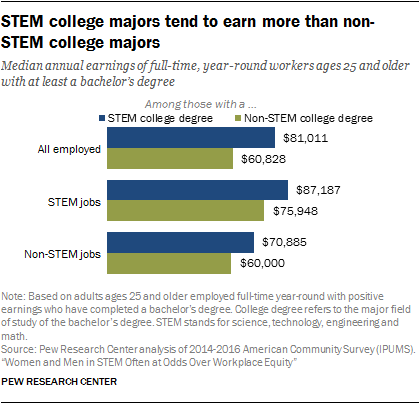
Across occupational categories – STEM and non-STEM alike – STEM-trained workers earn more, on average, than those with a degree in a non-STEM field of study. Among college-educated workers employed full-time and year-round, the median earnings for those who have a STEM college degree are $81,011, compared with $60,828 for other college degrees.
The earnings advantage for STEM training is apparent across all STEM job clusters, except for those in life science jobs.
The earnings advantage for those who majored in a STEM field extends to workers outside of STEM occupations. Among all non-STEM workers, those who have a STEM college degree earn, on average, about $71,000; workers with a non-STEM degree working outside of STEM earn roughly $11,000 less annually. The reasons behind this pay advantage are not wholly clear; in addition to the knowledge base and skills learned in a STEM degree, some have argued that the persistence and aptitudes needed to complete a STEM degree may be valued by employers outside the STEM workforce.
Among college graduates trained in STEM but employed in a non-STEM occupation, the most prevalent occupation is the management, business and finance cluster (17% of those with STEM training are employed in these fields). These jobs are particularly attractive to college graduates with engineering majors. Roughly a quarter (24%) of those who majored in engineering are in a management, business and finance occupation.
One factor that may be attracting STEM college majors to work outside of the STEM workforce is the high earnings potential of jobs in management, business and finance occupations. STEM-trained workers in computer occupations or working as engineers and architects are among the nation’s highest paid workers. The typical earnings are about $96,000. But the median earnings of a STEM-educated college graduate working in management, business and finance occupations are on par with that, about $97,000.30
On the flip side, roughly a quarter of college-educated workers in STEM jobs (26%) do not have a degree in a STEM field. Among college-educated engineers and architects, only 15% do not have a bachelor’s degree in STEM. Conversely, 52% of college-educated math workers do not have a college degree in a STEM field.31
Gender differences in college-level STEM training and retention in STEM occupations
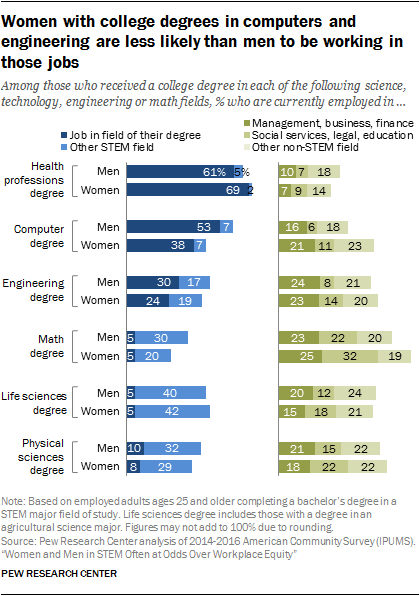
Overall, among adults who majored in STEM, women are more likely than men to work in a STEM occupation (56% vs. 49%).32 This difference is driven mainly by college graduates with a health professions degree, most of whom are women. About seven-in-ten (69%) women who majored in a health professions field are working in a health-related occupation, as are 61% of men who majored in a health professions field. (Of those who majored in a life sciences field, 30% of men and 33% of women work in a health-related occupation.)
Among college-educated workers with training in other STEM fields, however, men are often more likely than women to be working in jobs directly related to their major field of study. For example, 38% of women and 53% of men who majored in computers or computer science are employed in a computer occupation. Women with a college degree in engineering are less likely than men who majored in these fields to be working in an engineering job (24% vs. 30%). The differential retention rates of women in computer and engineering occupations is in keeping with other studies showing a “leaky pipeline” for women in STEM. See Appendix for details.


