The American Trends Panel (ATP), created by Pew Research Center, is a nationally representative panel of randomly selected U.S. adults. Panelists participate via self-administered web surveys. Panelists who do not have internet access at home are provided with a tablet and wireless internet connection. The panel is managed by Ipsos.
Data in this report are drawn from the panel wave conducted Jan. 22 to Feb. 5, 2019. A total of 6,637 panelists responded out of 9,402 who were sampled, for a response rate of 71%. This included 5,599 from the ATP and oversamples of 530 non-Hispanic black and 508 Hispanic respondents sampled from Ipsos’ KnowledgePanel. The cumulative response rate accounting for nonresponse to the recruitment surveys and attrition is 4.4%. The margin of sampling error for the full sample of 6,637 respondents is plus or minus 1.7 percentage points.
The subsample from the ATP was selected by grouping panelists into four strata so demographic groups that are underrepresented in the panel had a higher probability of selection than overrepresented groups:
- Stratum A consists of panelists who are non-internet users, have a high school education or less, non-Hispanic blacks, Hispanics, or non-Hispanic Asians. They were sampled at a rate of 100%.
- Stratum B consists of panelists that are unregistered to vote or non-volunteers. They were sampled at a rate of 55%.
- Stratum C consists of panelists that are 18 to 34 years old. They were sampled at a rate of 16%.
- Stratum D consists of the remaining panelists. They were sampled at a rate of 7%.
Panelists were grouped into these strata in hierarchical order from A to D. For example, a panelist who is not registered to vote and has a high school education or less would be in Stratum A rather than in Stratum B.
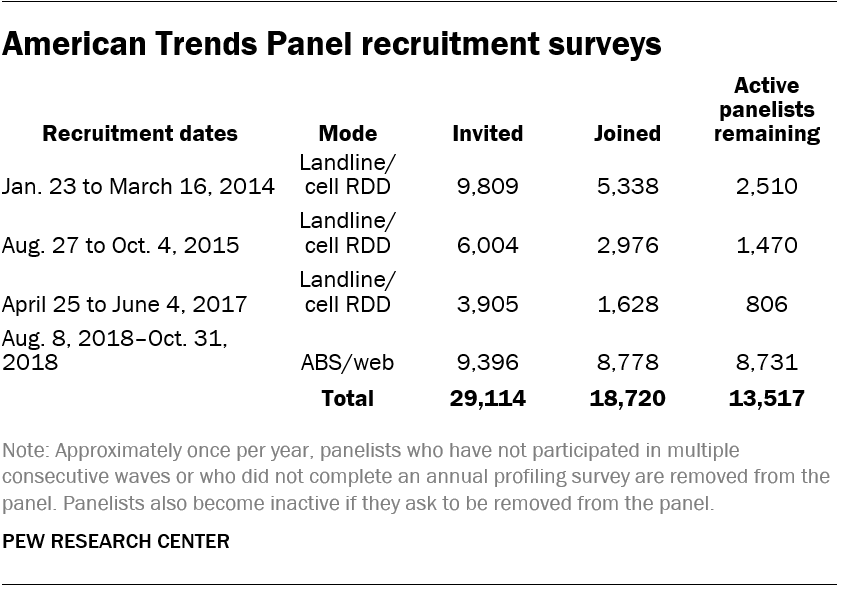
The ATP was created in 2014, with the first cohort of panelists invited to join the panel at the end of a large national landline and cellphone random-digit-dial survey that was conducted in both English and Spanish. Two additional recruitments were conducted using the same method in 2015 and 2017, respectively. Across these three surveys, a total of 19,718 adults were invited to join the ATP, and 9,942 of them agreed to participate.
In August 2018, the ATP switched from telephone- to address-based recruitment. Invitations were sent to a random, address-based sample (ABS) of households selected from the U.S. Postal Service’s Delivery Sequence File. In each household, the adult with the next birthday was asked to go online to complete a survey, and, at the end, they were invited to join the panel. For a random half-sample of invitations, households without internet access were instructed to return a postcard. These households were contacted by telephone and sent a tablet if they agreed to participate. A total of 9,396 were invited to join the panel; 8,778 agreed to join the panel and completed an initial profile survey.
Of the 18,720 individuals who have ever joined the ATP, 13,517 remained active panelists and continued to receive survey invitations at the time this survey was conducted.
Weighting
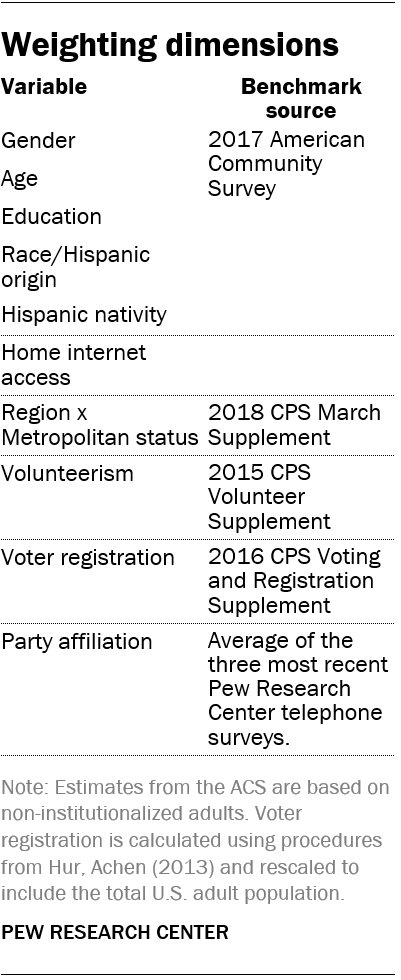
The data were weighted in a multistep process that begins with a base weight incorporating the respondents’ original survey selection probability and the fact that in 2014 and 2017 some respondents were subsampled for invitation to the panel. The sample was then combined with the non-Hispanic black and Hispanic oversamples and post-stratified to match federal benchmarks for race and Hispanic ethnicity. The next step in the weighting uses an iterative technique that aligns the sample to population benchmarks on the dimensions listed in the accompanying table.
Sampling errors and tests of statistical significance take into account the effect of weighting. Interviews are conducted in both English and Spanish.
In addition to sampling error, one should bear in mind that question wording and practical difficulties in conducting surveys can introduce error or bias into the findings of opinion polls.
The following table shows the unweighted sample sizes and the error attributable to sampling that would be expected at the 95% level of confidence for different groups in the survey:
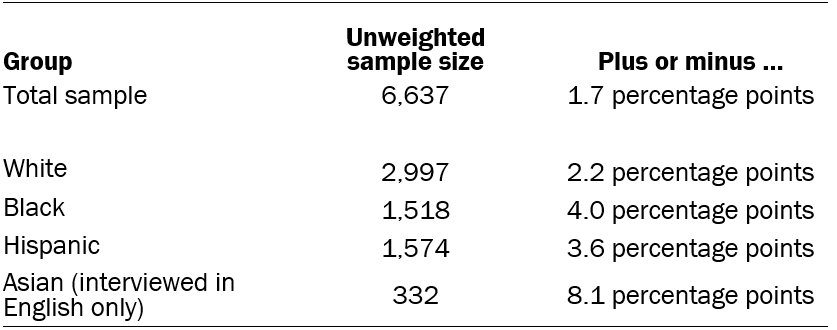
Sample sizes and sampling errors for other subgroups are available upon request.
Telephone survey methodology
The analysis of the question about how Barack Obama handled race relations is based on telephone interviews conducted Jan. 15-Feb. 3, 2019, among a national sample of 1,432 adults, ages 18 and older, living in the United States (526 respondents were interviewed on a landline telephone, and 906 were interviewed on a cellphone, including 610 who had no landline telephone). Interviews conducted from Jan. 15-20 were among the total population of respondents. Interviews conducted Jan. 22-27 and Jan. 29-Feb. 3 were conducted among Hispanic and black respondents only. The survey was conducted under the direction of SSRS. A combination of landline and cellphone random-digit-dial samples were used; both samples were provided by Marketing Systems Group. Interviews were conducted in English and Spanish. Respondents in the landline sample were selected by randomly asking for the youngest adult male or female who is now at home. Interviews in the cell sample were conducted with the person who answered the phone if that person was an adult age 18 or older.
For detailed information about our survey methodology, see http://www.pewresearch.org/methodology/u-s-survey-research/
The combined landline and cellphone sample are weighted to provide nationally representative estimates of the adult population ages 18 and older. The weighting process takes into account the disproportionate probabilities of household and respondent selection due to the number of separate telephone landlines and cellphones answered by respondents and their households, as well as the probability associated with the random selection of an individual household member. It also takes into account the oversample of non-Hispanic black and Hispanic respondents. Following application of the above weights, the sample is post-stratified and balanced by key demographics such as age, race, sex, region, education and Hispanic nativity. The sample is also weighted to reflect the distribution of phone usage in the general population, meaning the proportion of those who are cellphone only, landline only, and mixed users.
The following table shows the unweighted sample sizes and the error attributable to sampling that would be expected at the 95% level of confidence for different groups in the survey:
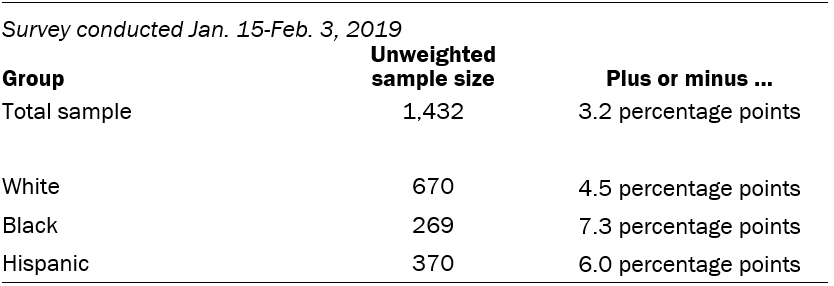
Sample sizes and sampling errors for other subgroups are available upon request.
In addition to sampling error, one should bear in mind that question wording and practical difficulties in conducting surveys can introduce error or bias into the findings of opinion polls.
Pew Research Center undertakes all polling activity, including calls to mobile telephone numbers, in compliance with the Telephone Consumer Protection Act and other applicable laws.
© Pew Research Center, 2019


