
have traditionally been common. This report looks at how Millennials are forming their own families – focusing on living arrangements, marriage rates and birth rates – and compares Millennials to previous generations at the same age.
For the majority of this analysis, we compared members of four generations when they were ages 23 to 38 years old: Millennials in 2019, Gen Xers in 2003, Baby Boomers in 1987 and members of the Silent Generation in 1968. Most of the demographic data in this report were derived from the Current Population Survey Annual Social and Economic Supplement (ASEC), which is conducted in March of every year. For the fertility analysis, we looked at adults ages 22- to 37-years old. For generational comparisons of fertility data, we examined Millennials in 2018, members of Gen X in 2002, and Baby Boomers in 1986. There is no comparable fertility data available for members of the Silent generation. Fertility data are derived from the June Fertility Supplement.
As Millennials reach a new stage of life – the oldest among them will turn 39 this year – a clearer picture of how members of this generation are establishing their own families is coming into view. Previous research highlights not only the sheer size of the Millennial generation, which now surpasses Baby Boomers as the largest, but also its racial and ethnic diversity and high rates of educational attainment. This research also notes that Millennials have been slower than previous generations to establish their own households.
A new analysis of government data by Pew Research Center shows that Millennials are taking a different path in forming – or not forming – families. Millennials trail previous generations at the same age across three typical measures of family life: living in a family unit, marriage rates and birth rates.
Unless otherwise noted, Millennials in this report are defined as adults ages 23 to 38 years old in 2019. Previous generations are defined as follows: Generation X (Gen X) is defined as adults ages 23 to 38 years old in 2003; Baby Boomers are adults ages 23 to 38 in 1987; and members of the Silent Generation are adults ages 23 to 38 years old in 1968.
In this report, a person is considered to be “in a family” if they reside with a spouse, their own child (including biological, adopted and stepchildren) or both. Adults who have a spouse that is currently living apart from them (but from whom they are not legally separated) are considered to be living with that spouse for this analysis.
Cohabitation is a term used to describe adults who live with an unmarried romantic partner.
Marriage data includes both opposite-sex and same-sex couples.
References to whites, blacks and Asians include only those who are non-Hispanic and identify as only one race. Asians include Pacific Islanders. Hispanics are of any race.
When discussing marriage, the terms “multiracial or multiethnic” and “intermarriage” are used interchangeably to denote marriages that include partners with different racial and ethnic backgrounds. See methodology for more information.
References to college graduates or people with a college degree comprise those with a bachelor’s degree or more. “Some college” includes those with an associate degree and those who attended college but did not obtain a degree. “High school” refers to those who have a high school diploma or its equivalent, such as a General Education Development (GED) certificate.
Millennials are less likely to live with a family of their own than previous generations were at the same stage of life
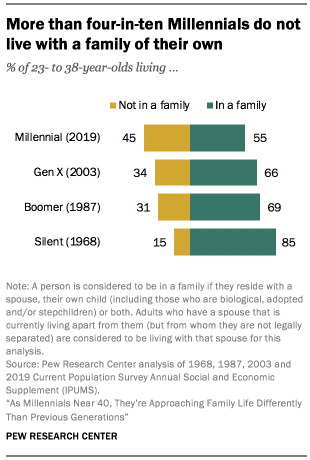
Living with a family is defined here as living with a spouse, one’s own child (or children) or both a spouse and child. Using this definition, Millennials are much less likely to be living with a family of their own than previous generations when they were the same age. In 2019, 55% of Millennials lived in this type of family unit. This compares with 66% of Gen Xers in 2003, 69% of Boomers in 1987 and 85% of members of the Silent Generation in 1968.
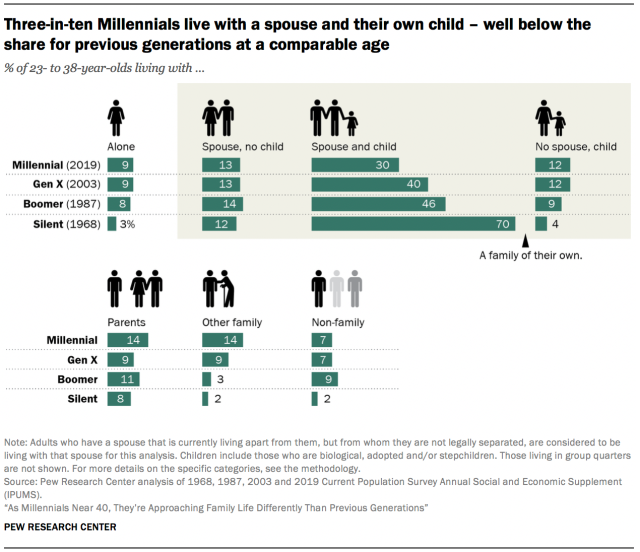
Millennials lag furthest behind in the share living with a spouse and child. Only three-in-ten Millennials fell into this category in 2019, compared with 40% of Gen Xers, 46% of Boomers and 70% of Silents when they were the age Millennials are now. At the same time, the share of Millennials who live with a spouse and no child is comparable to previous generations (13%), while the share living with a child but no spouse (12%) is the same as Gen X but higher than Boomers and Silents.
Among Millennials, there are significant differences in the share living in a family of their own by race, ethnicity and educational attainment. Black Millennials are the least likely to live in a family – 46% do, compared with 57% of white and Hispanic Millennials and 54% of Asians. Black Millennials are more likely than other groups to live with a child and no spouse (22%, compared with 16% of Hispanic, 9% of white and 4% of Asian Millennials).
Overall, Millennials with less than a high school diploma are more likely than those with more education to live in a family (63% compared with 55% each of high school graduates, those with some college education and college graduates).
Millennials with a bachelor’s degree or more education are more likely than those with less education to live with a spouse and no child (18% compared with 11% of those with some college education, 10% of high school graduates, and 7% of those with less than a high school diploma). College-educated Millennials are the least likely to live with a child and no spouse (4%), while those with less than a high school education are the most likely to fall into this category (21%).
A look at Millennials who aren’t living with a family of their own reveals that most live in other family arrangements: 14% of Millennials live with their parents, and another 14% live with other family members. In both cases, these shares are higher than for other generations when they were in their 20s and 30s. Previous research has shown that, even after the economy started to recover from the Great Recession, the share of Millennials living in their parents’ homes continued to rise. Millennial men are much more likely than Millennial women to live with their parents (18% of men compared with 10% of women). Millennial men without a college degree are especially likely to fall into this category (21%, compared with 12% of Millennial men with a bachelor’s or higher degree).
About one-in-ten Millennials (9%) live alone. This is similar to the share of Gen Xers and Boomers who did so at a comparable age but higher than the share of Silents. Some 7% of Millennials live in a household with non-family members.
More than half of Millennials are not married, and those who are got married later in life
A majority of Millennials are not currently married, marking a significant change from past generations. Only 44% of Millennials were married in 2019, compared with 53% of Gen Xers, 61% of Boomers and 81% of Silents at a comparable age.
What does marriage look like for Millennials who have tied the knot? They are getting married later in life than previous generations. The median age at first marriage has edged up gradually in recent decades. In 2019, the average man first got married at age 30, and the average woman was 28 when she first wed. This is three years later – for both men and women – than in 2003, four years later than in 1987 and seven years later than in 1968.
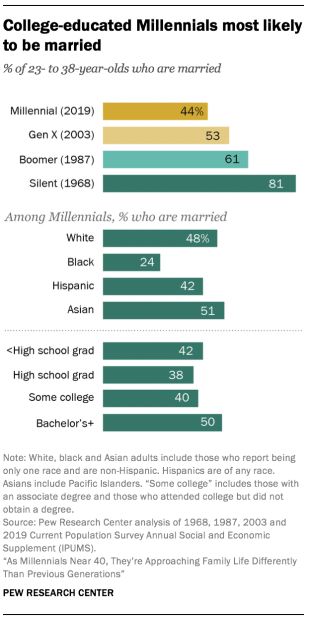
Black Millennials are far less likely to be married than Millennials in other racial and ethnic groups: 24% compared with 51% of Asian, 48% of white and 42% of Hispanic Millennials. This racial and ethnic pattern is similar for older generations, but the gap between black adults and other groups has widened since 1968.
Half of all Millennials with a bachelor’s degree or more education are married, which is higher than the share among those with less education. The largest gap emerges when comparing the shares of Millennials with a bachelor’s degree (50%) and those with a high school education (38%) who are married. There’s a 10-point gap in the share married between those with a bachelor’s degree and those with some college education (40%). Some 42% of Millennials with less than a high school education are married.
The education gap in marriage, which has been growing over time, is wider for Millennials than it has been in previous generations. Overall, marriage rates have declined since 1970, and the sharpest declines have been amongst the least educated adults.
Millennials more likely than Gen Xers when they were younger to be living with a romantic partner
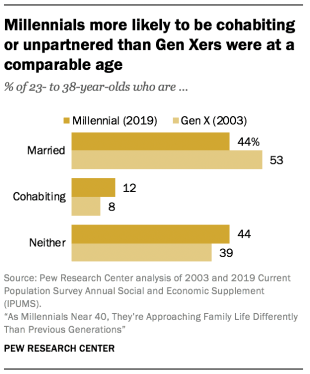
As Millennials delay marriage, a significant share are living with a romantic partner. In 2019, 12% of Millennials were living with an unmarried partner – higher than the share of Gen Xers (8%) who were cohabiting in 2003.1 Cohabitation is more common among Millennials than Gen Xers across most racial and ethnic categories, as well as educational attainment.
White Millennials are more likely than other racial and ethnic groups to be currently cohabiting with a partner: 14% of whites do, compared with 11% of black, 12% of Hispanic and 6% of Asian Millennials. Millennials with less than a college education are more likely to live with a partner than are those with a bachelor’s degree (13% vs. 11%). Even so, the share of college-educated Millennials who are cohabiting is substantially higher than it was for college-educated Gen Xers at a comparable age.
More than one-in-ten married Millennials have a spouse who is of a different racial or ethnic background
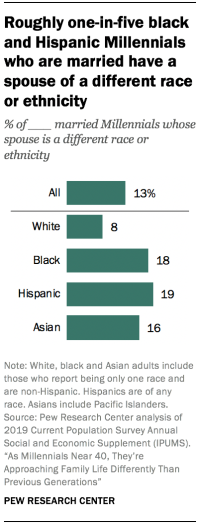
Some 13% of Millennial marriages include spouses of differing racial or ethnic backgrounds.2 This is significantly higher than the share of Gen X marriages that were multiracial or multiethnic in 2003 (9%).3 As noted in a 2017 Pew Research Center report, rates of intermarriage have gone up over time. These shifts can be attributed to the removal of laws criminalizing interracial marriage in many states, including the landmark Loving v. Virginia decision in 1967, as well as cultural shifts that make interracial marriage more acceptable and the growing racial and ethnic diversity in the country.
Among married Millennials, 8% of whites are married to someone of a different race or ethnicity. The shares are higher among Hispanic (19%), black (18%) and Asian (16%) Millennials.4
Intermarriage rates are higher for Millennials than for Gen Xers across all racial and ethnic groups. The generational leap in intermarriage is most notable for Hispanic and black adults. The rate of intermarriage among black Millennials is nearly twice as high as that of black Gen Xers at a comparable age (18% vs. 10%).
Millennials are more likely than previous generations to marry someone with the same level of education as them
Millennials are more educated than previous generations of young adults, and they’re more likely to be married to someone who shares their educational credentials. Among married Millennials with a bachelor’s degree or more education, 75% are married to another college graduate. This is higher than Gen Xers (68%), Boomers (63%) or Silents (52%) when they were the age Millennials are now. Some 16% of Millennials with a bachelor’s degree married someone with some college education, 9% are married to a high school graduate, and 1% of Millennials with a college degree married someone with less than a high school education.
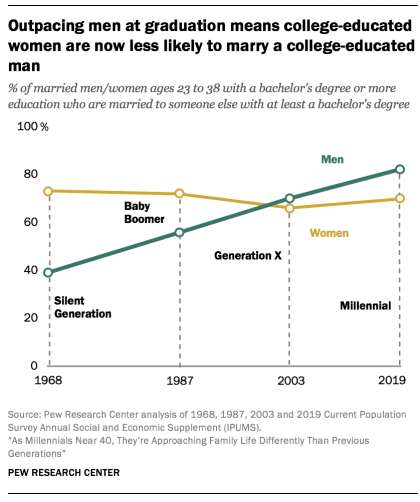
College-educated Millennial women are less likely to have a spouse with a college degree than are their male counterparts (70% vs. 82%). This was also the case for Gen Xers (66% of college-educated Gen X women were married to someone with a bachelor’s degree, compared with 70% of college-educated Gen X men). This disparity can be explained by recent data showing more women are graduating from college than men, thus making the ratio of college-educated men to women unbalanced (fewer men than women). The pattern was the opposite for Boomers and Silents: Men were less likely to marry someone with a college degree than women. This reversal can be partially attributed to the fact that, during this time, fewer women went to college, resulting in a smaller pool of college-educated women for men to marry.
Across all levels of education, Millennial men are more likely than women to marry someone with higher educational credentials. For example, 18% of Millennial men with a high school diploma or less marry someone with a bachelor’s degree or more (compared with 9% of Millennial women). Some 33% of Millennial men with some college education marry someone with a bachelor’s degree or more (compared with 22% of Millennial women).
More than half of Millennial women have given birth; they are older than previous generations when they do
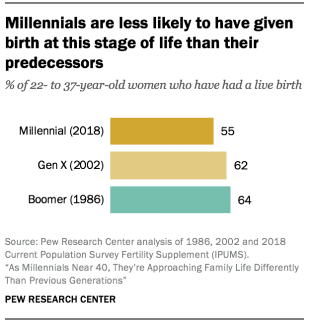
As of 2018, approximately 19 million Millennial women had given birth to a child. This amounts to more than half (55%) of all Millennial women, smaller than the shares of previous generations of women who had given birth at a comparable age. Some 62% of Gen X women and 64% of Boomer women were mothers when they were ages 22 to 37.5
Among Millennials, Hispanic and black women are more likely than white and Asian women to have given birth. This pattern holds true for Gen X women as well.
It should be noted that these figures reflect fertility for 22- to 37-year-olds, not completed fertility. Millennial women, especially the youngest among them, still have many years to complete their fertility. And some Gen X women are still in their child-bearing years. (Researchers typically define childbearing age as 15 to 44.)
Previous research has shown that women are waiting longer to give birth, with many becoming first-time mothers in their 40s. This is reflected in data showing that the age of first-time mothers has increased over time. In 2015, when the oldest Millennial was 34, the mean age for mothers was 26.4 – up from 22.7 in 1980. Delayed childbearing and a decline in teenage pregnancies are partial explanations for this shift.
While Millennial women are less likely to have given birth, those who are mothers aren’t necessarily having fewer children. In 2018, Millennial women who had given birth had an average of 2.02 children. At similar ages, Gen X women had 2.07 children and Boomer women had 2.05 children, on average.
Millennial mothers are more likely than mothers from previous generations to be unmarried. Some 33% of Millennial moms living with their own children younger than 18 are unmarried, compared with 29% of Gen X moms, 23% of Boomer moms and 9% of Silent moms at the same age. Millennial moms with a college education (14%) are much less likely to be unmarried than those with less than a college degree (44%). There are also differences by race and ethnicity: Among Millennial mothers, black women (67%) are more likely to be unmarried than are Hispanic (39%), white (24%) or Asian (11%) women.
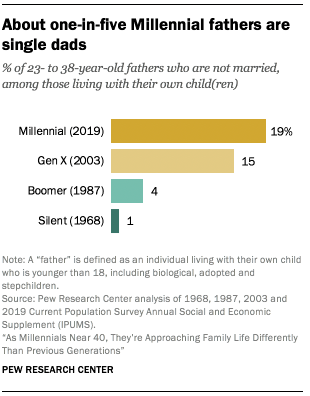
A third of Millennial men live in a household with their own children
While there are no comparable fertility measures for fathers in the Current Population Survey, data from an ongoing national survey finds that Millennial men are less likely to be fathers at this stage of life than Gen X men were at a comparable age. In 2018, 40% of Millennial men ages 22 to 37 said they had fathered a child; this compares with 46% among Gen X men in 2002.
Another way to measure fatherhood is by looking at the share of men who report living at home with their own children (those younger than 18), although it is important to note that these numbers do not distinguish whether these children are biological, adopted or stepchildren.
Millennial men are less likely to be living in a household with their own children than was the case for previous generations of men at a comparable age. In 2019, 32% of Millennial men reported living in a household with their own children, compared with 41% of Gen X men in 2003, 44% of Boomer men in 1987 and 66% of Silent men in 1968.
Hispanic and white Millennial men (34% for both) are more likely than their black (23%) and Asian counterparts (27%) to be living with children of their own. For Millennial men, those with more education are less likely to live with children of their own. For example, 40% of Millennial men with less than a high school diploma live with children of their own compared with 31% of Millennial men with a bachelor’s degree or higher.
Most Millennial dads who reside with their children are living with a spouse. And, in most of those households, both parents are working. In 66% of households with a married couple and at least one child younger than 18 in which one or both spouses is a Millennial, both parents were employed in 2018 (the year prior to the survey). This is the same as the share among Gen X and Boomer households in 2002 and 1986 with two married parents and one or more children younger than 18. But times have changed a lot in this regard since members of the Silent Generation were raising their children. In 1967, only 44% of Silent households with two married parents and at least one child had two working parents.
About one-in-five Millennial men residing with their own child or children are unmarried. This is significantly higher than the shares for previous generations: 15% of Gen X fathers, 4% of Boomer fathers and 1% of dads in the Silent Generation were unmarried at a comparable age.


