How we did this
Using the well-known National Center for Health Statistics’ Urban-Rural Classification Scheme for counties, counties in metropolitan areas with at least 1 million residents were considered to be either urban core counties or outlying suburban counties. Non-metropolitan counties and counties comprising metropolitan areas with a population of fewer than 1 million people were not exhaustively analyzed.
County population figures are based on the July 1, 2018, vintage of U.S. Census Bureau population estimates. These are the most recent county population estimates available by age.
Estimates of the educational profile, employment and other economic characteristics of urban core and suburban counties are based on Census Bureau data collected in the American Community Survey and the 2000 decennial census.
The results presented in this report are derived by summing outcomes over counties, effectively giving more weight to counties with larger populations. The trends identified are not sensitive to this weighting, as examination of outcomes for the median county show similar results.
The analysis of how suburban and urban core counties are changing along demographic and economic lines, based on data from the U.S. Census Bureau, relies on county-level classifications created by the National Center for Health Statistics at the Centers for Disease Control and Prevention.
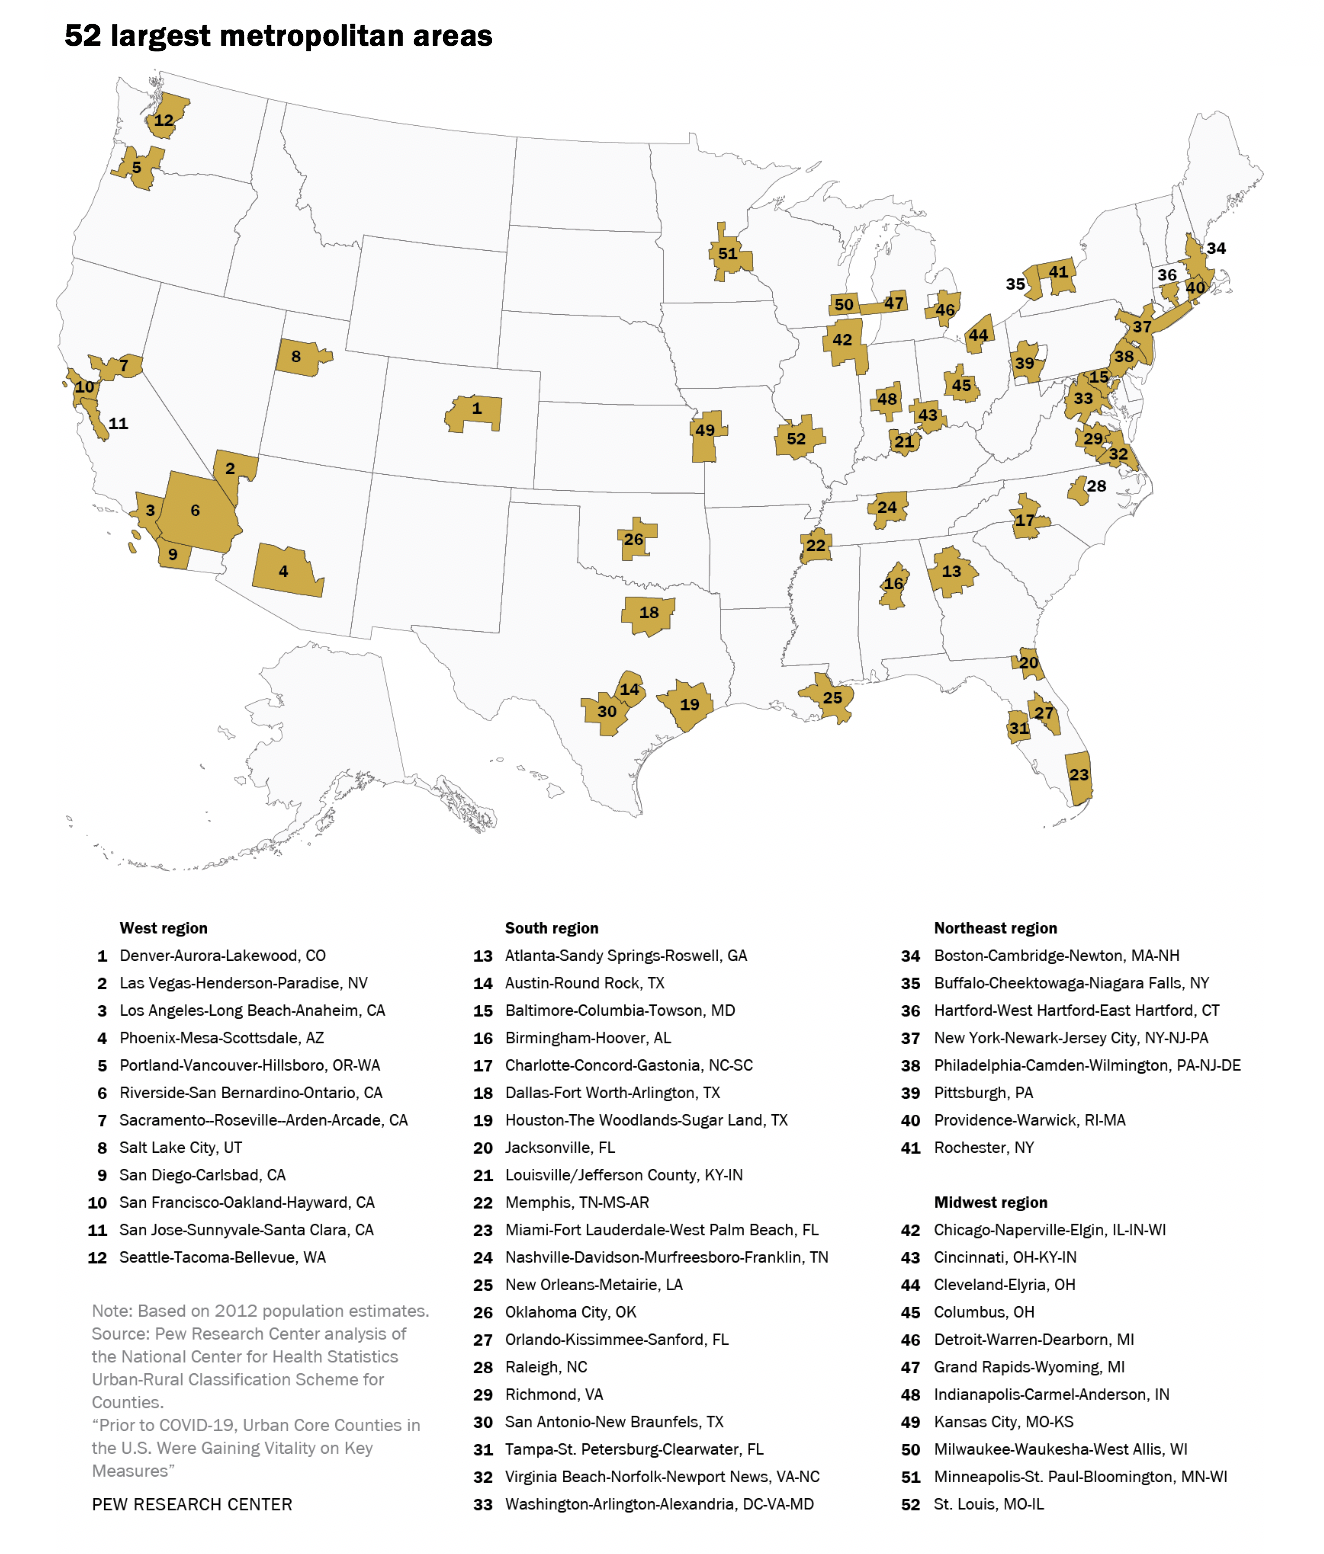
Throughout the report, the terms “urban core” and “central city” are used interchangeably to refer to the large central metropolitan counties. These are the 68 counties that are part (or contain the entirety) of the largest principal city of metropolitan areas with at least 1 million residents. Suburban counties or large suburban counties are the outlying counties of metropolitan areas with at least 1 million residents. In 2018, a majority of the U.S. population lived in these 438 urban core and suburban counties, and thus demographers, economists and urban planners often focus on them. Other counties that are in metropolitan areas with fewer than 1 million people (medium and smaller metros) or nonmetropolitan areas are not the focus of this analysis.
References to college graduates or people with a college degree comprise those with a bachelor’s degree or more.
The working-age population refers to those age 16 and older.
A full-time, year-round worker is a person who worked at least 35 hours per week (full-time) and at least 50 weeks during the previous calendar year (year-round).
Poverty refers to persons living in families with incomes below the official poverty threshold. Thresholds vary by family size and composition. For example, in 2018, the poverty threshold for a family of four with one related child under the age of 18 was $26,324.
The Northeast census region comprises Connecticut, Maine, Massachusetts, New Hampshire, New Jersey, New York, Pennsylvania, Rhode Island and Vermont. The Midwest region comprises Illinois, Indiana, Iowa, Kansas, Michigan, Minnesota, Missouri, Nebraska, North Dakota, Ohio, South Dakota and Wisconsin. The South region comprises Alabama, Arkansas, Delaware, District of Columbia, Florida, Georgia, Kentucky, Louisiana, Maryland, Mississippi, North Carolina, Oklahoma/Indian Territory, South Carolina, Tennessee, Texas, Virginia and West Virginia. The West region comprises Alaska, Arizona, California, Colorado, Hawaii, Idaho, Montana, Nevada, New Mexico, Oregon, Utah, Washington and Wyoming.
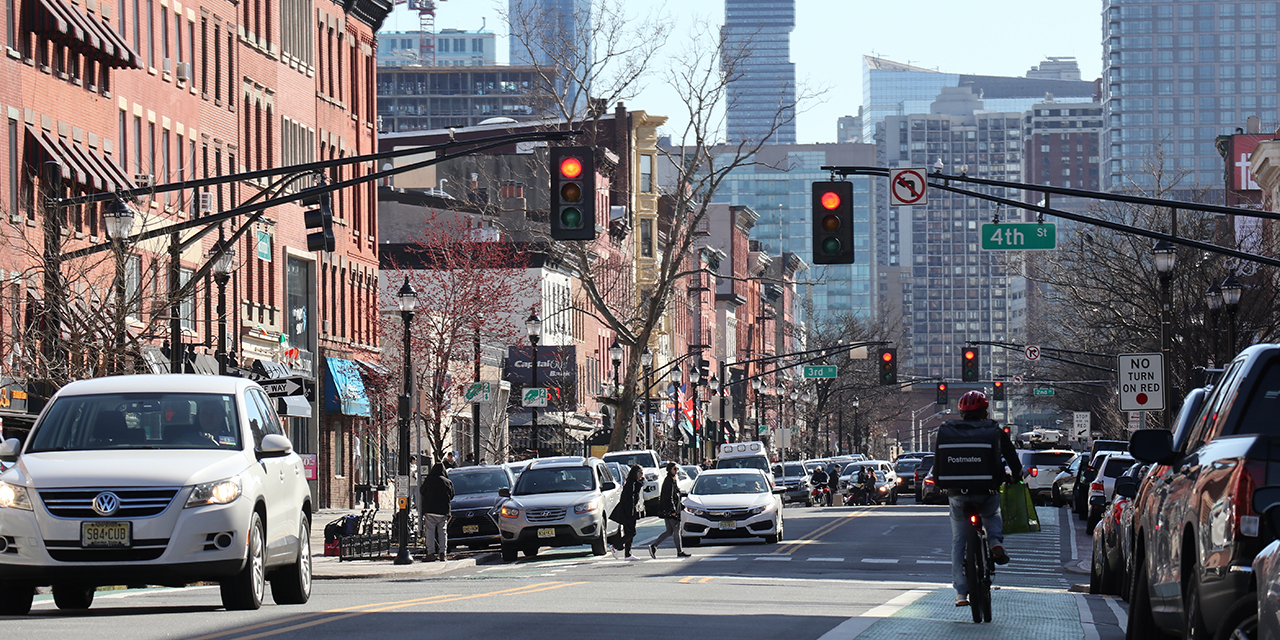
Following decades of rising population and affluence compared with the central cities, the luster of the nation’s large suburbs has diminished since 2000. Though the suburban population continues to increase at a relatively healthy clip, a range of indicators show that large suburban counties are lagging the gains of their urban core counterparts. Compared with 2000, suburban populations are now less engaged in the labor market, experiencing declining household incomes and seeing housing stock value that has not kept pace with that of the central cities.
While many factors are likely at play, demographic trends are contributing to the changing fortunes of large suburban counties. These counties are growing at opposite ends of the age spectrum, seeing an increase in adults ages 65 and older and those under age 25. But they are losing out to urban core counties when it comes to prime working-age adults – those ages 25 to 44 – who are increasingly residing in the urban core counties.
This analysis is based on the most recent available data and tracks outcomes as of 2018. While there is some preliminary evidence that the COVID-19 outbreak may have altered people’s residential choices between city versus suburbs, it is too soon to have a full picture of its long-term impact. Some demographers have asserted residential outcomes will partly depend on policy decisions. The analysis in this report explores the direction of suburban-urban gaps before the onset of COVID-19.
Suburban and urban core counties
Much has been written about the resurgence of young, better-educated adults in the nation’s urban cores. 1 Less attention has been given to the residential patterns of the growing population of older adults, who increasingly live in the suburbs. The shifting patterns of where prime-age young adults and older Americans reside has implications for both the suburbs surrounding the urban core counties and the central cities themselves. Though the suburbs are continuing to outgain the urban cores in terms of population, some of the long-standing economic and social gaps between cities and suburbs are narrowing in the new century.
Since 2000, the U.S. population has been increasingly concentrated in the 52 largest metropolitan areas, particularly their suburban counties. The population of the large suburban counties has increased by 25% in the new century, outpacing the nation’s overall population growth (16%). The population in the urban core counties grew at the same pace as the national average.
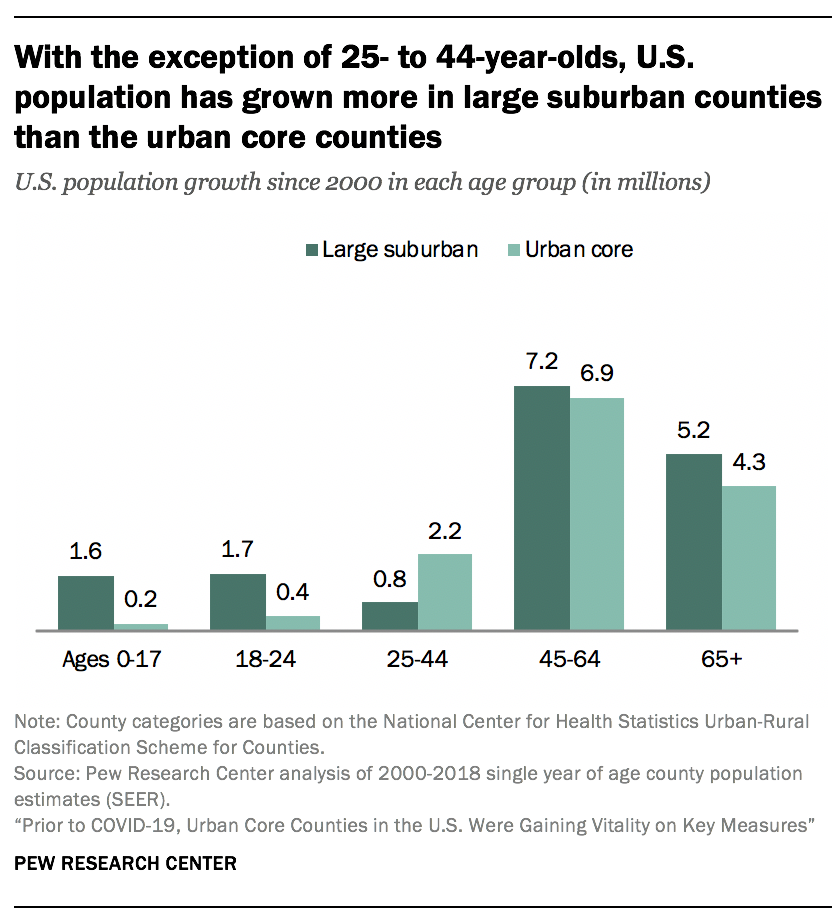
Compared with their urban core counterparts, the population growth in suburban counties has been at the ends of the age spectrum. The suburbs have been gainers of children and 18- to 24-year-olds, as well as adults 65 and older. But they have lagged the urban core counties in growth of 25- to 44-year-olds. Since 2000, the population younger than 25 has increased by 3.3 million in the suburbs, compared with about 700,000 in the urban core counties. The population ages 65 and older has grown by 5.2 million in the suburbs, versus only 4.3 million in the urban core. The population gains flip in the middle ages. The 25- to 44-year-old population increased by only 800,000 in the suburbs, trailing the 2.2 million gain of the center counties. Population gains among 45- to 64-year-olds were more even between suburban and urban core counties, increasing about 7.0 million in both.
The changing age structure in suburban counties may be contributing to the falling vitality of the nation’s suburbs across a range of indicators. Education, labor market, income and housing metrics reveal that the suburbs have trailed the gains of the urban core counties in the new century.
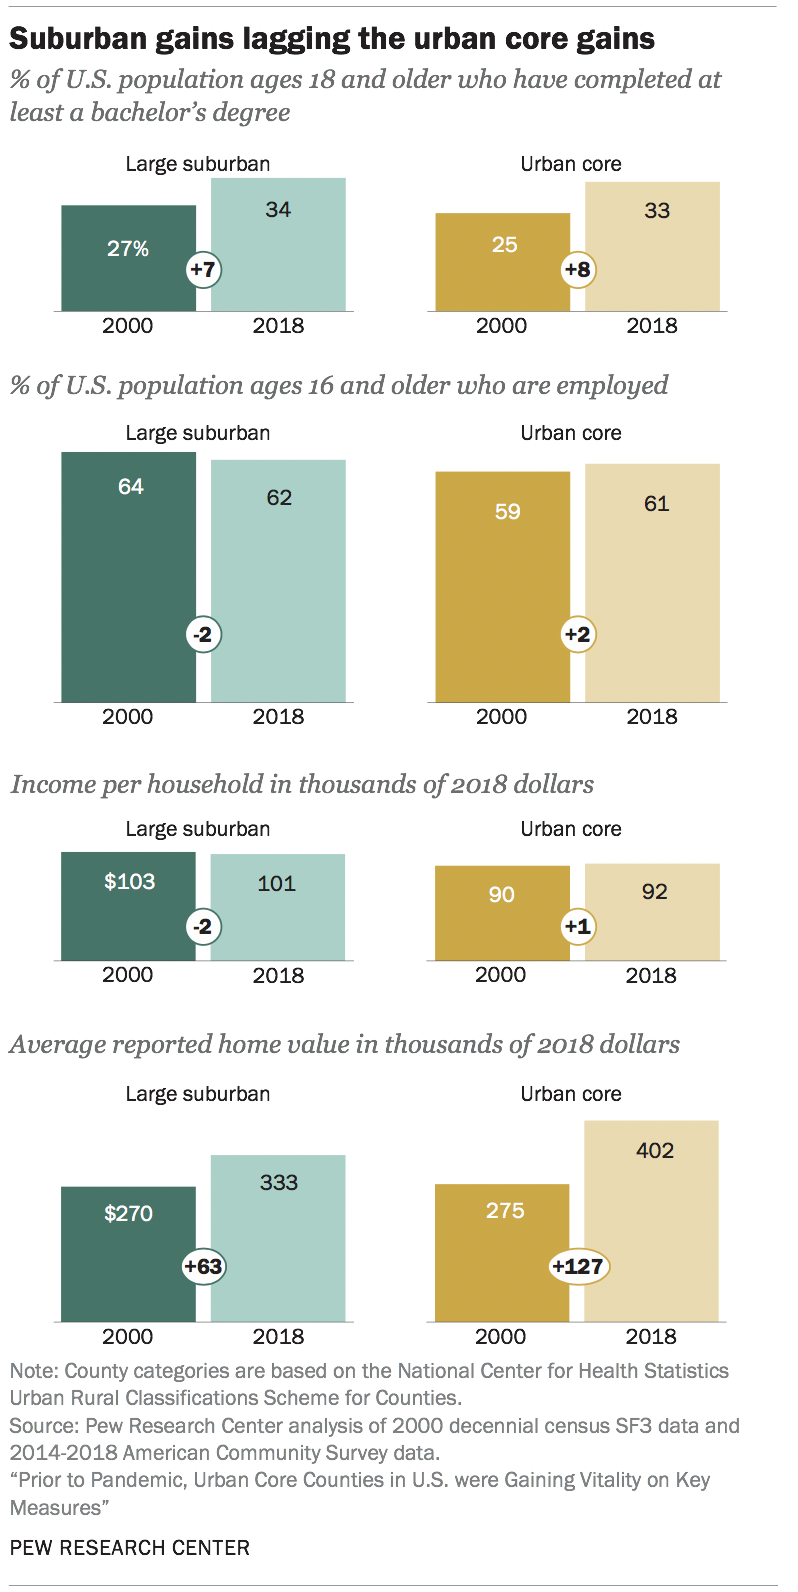
The outlying suburban population is better educated than residents of the urban core counties, as measured by formal degree attainment, but that advantage is diminishing. In 2000, 27% of suburban adults had completed at least a bachelor’s degree, compared with 25% of urban core adults. By 2018, 34% of the suburban adult population had finished college, compared with 33% of their urban core peers.
A declining share of the working age population in the suburbs is employed, but employment is on the upswing in the urban core counties. In 2000, 64% of the suburban population ages 16 and older was employed, outpacing those in the urban core counties (59%). By 2018, the employment gap had substantially narrowed (62% in suburbia and 61% in the urban core counties).
The household income gap between the suburbs and urban core counties has also narrowed. The average household income was $101,000 in the large suburban counties in 2018, a decline from $103,000 in the 2000 census. Average household income in the urban core was $92,000 in 2018, an increase from $90,000 in 2000.
As other researchers have noted, home prices have also been on a different trajectory in urban core counties versus outlying suburban areas. Based on homeowners’ self-reported assessment of the value of their property, average home values in the suburban counties have increased in the new century, from $270,000 in 2000 to $333,000 in 2018. This pales in comparison to the average home value appreciation that has occurred in the urban core, where home values have increased from $275,000 in 2000 to $402,000 in 2018.
Large suburban populations increasingly comprised of children and adults 65 and older
As of 2018, 183.4 million people – more than half of the total U.S. population – lived in the 52 largest metropolitan areas. The large metros range in population from the New York metro area (20.0 million as of 2018) to Grand Rapids, Michigan (1.1 million).
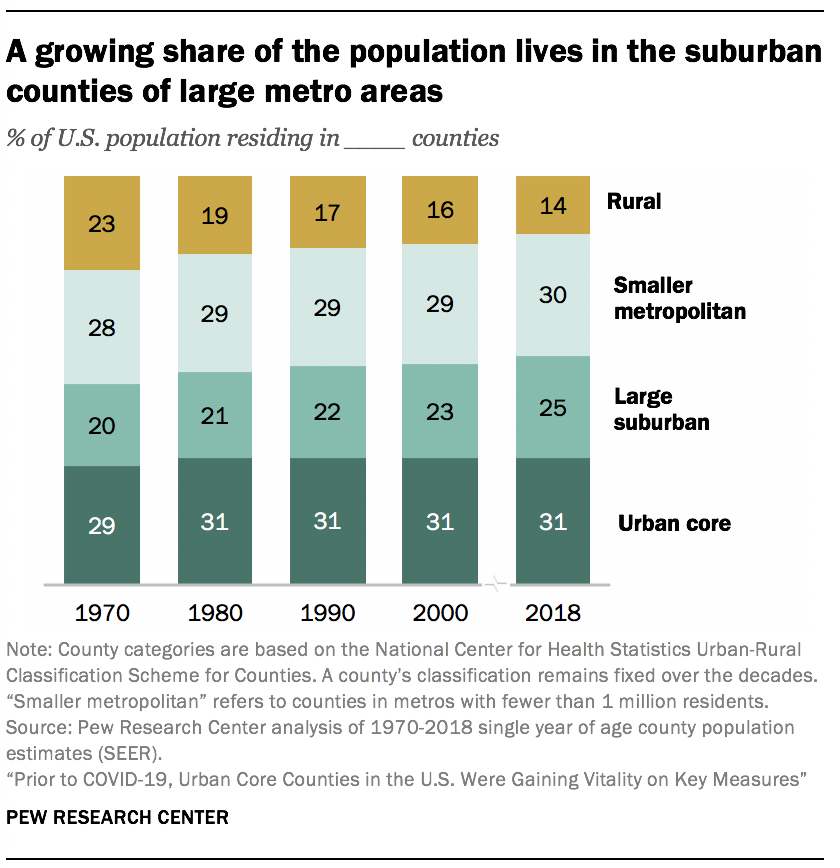
Since 2000, the nation’s population has been increasingly concentrated in the suburban counties surrounding the urban core counties of the largest metro areas. In the new century, the big metro areas gained 30.6 million residents, with the majority of the increase (16.6 million) occurring in the suburbs. By 2018, 25% of the total U.S. population resided in the large suburban counties, up from 23% in 2000. In contrast, the share of the population living in the urban cores remained at 31%.
The population gain in large suburban counties, as well as in smaller metropolitan counties, occurred at the expense of rural counties. Some 14% of the total U.S. population lived in rural counties in 2018, a decline from 16% in 2000.
The recent population gains of the large suburban counties are a continuation of trends observed in the latter decades of the 20th century. In the 1970s, both the urban core counties and the outer suburban counties gained population share. Since 1980, the share of the nation’s total population residing in the urban core has remained at 31%, while the share residing in the large suburban counties continued to grow.
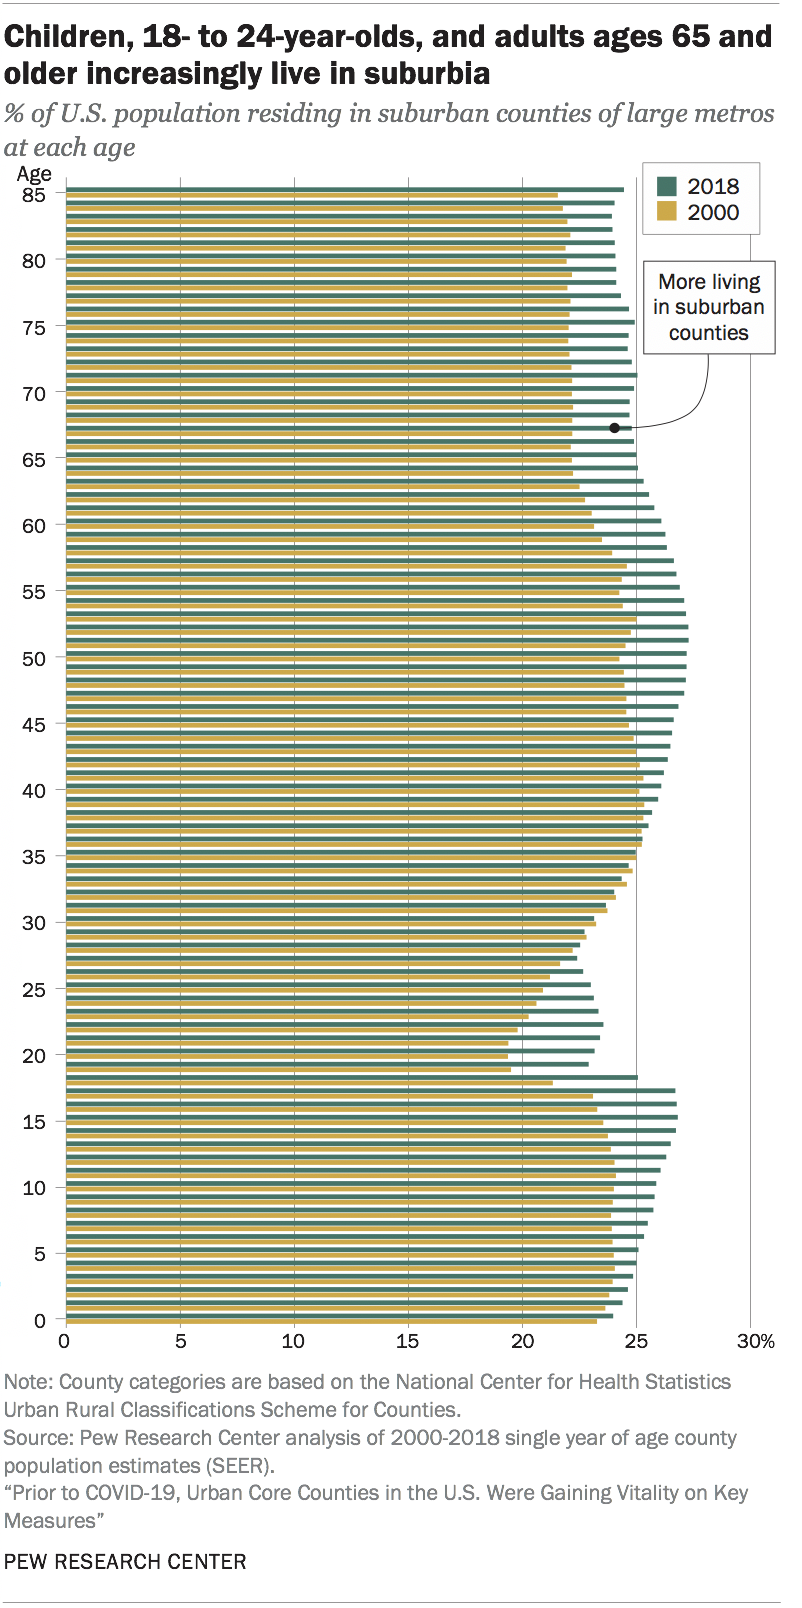
The increasing propensity to live in the suburbs of the largest metro areas is not uniform across age groups, with important consequences for the age profile of the suburbs relative to the inner core counties. The suburbs are increasingly where the nation’s children and younger adults reside. In 2018, 26% of children younger than 18 lived in large suburban counties, up from 24% in 2000. The share of young adults between the ages of 18 to 24 living in the suburbs stood at 24% in 2018, compared with 20% in 2000. This may be a reflection of the well-documented growing tendency of 18- to 24-year-olds to live with their parents (who increasingly reside in the suburbs). Meanwhile, adults between the ages of 25 and 44 are more apt to live in the urban core counties than they were in 2000.
Along with children and young adults 18 to 24, Americans 65 and older also increasingly reside in the large suburban counties (25% live there, up from 22% in 2000). At the same time, the share of older Americans living in urban cores has ticked down in the new century (27%, down from 28% in 2000).
The upshot is that the large suburban counties now have more of their population in the ends of the age spectrum and fewer in the middle relative to the urban core counties. The large suburban counties are increasingly composed of those under age 25 and adults 65 and older (many of whom are not working), who are often considered dependents.
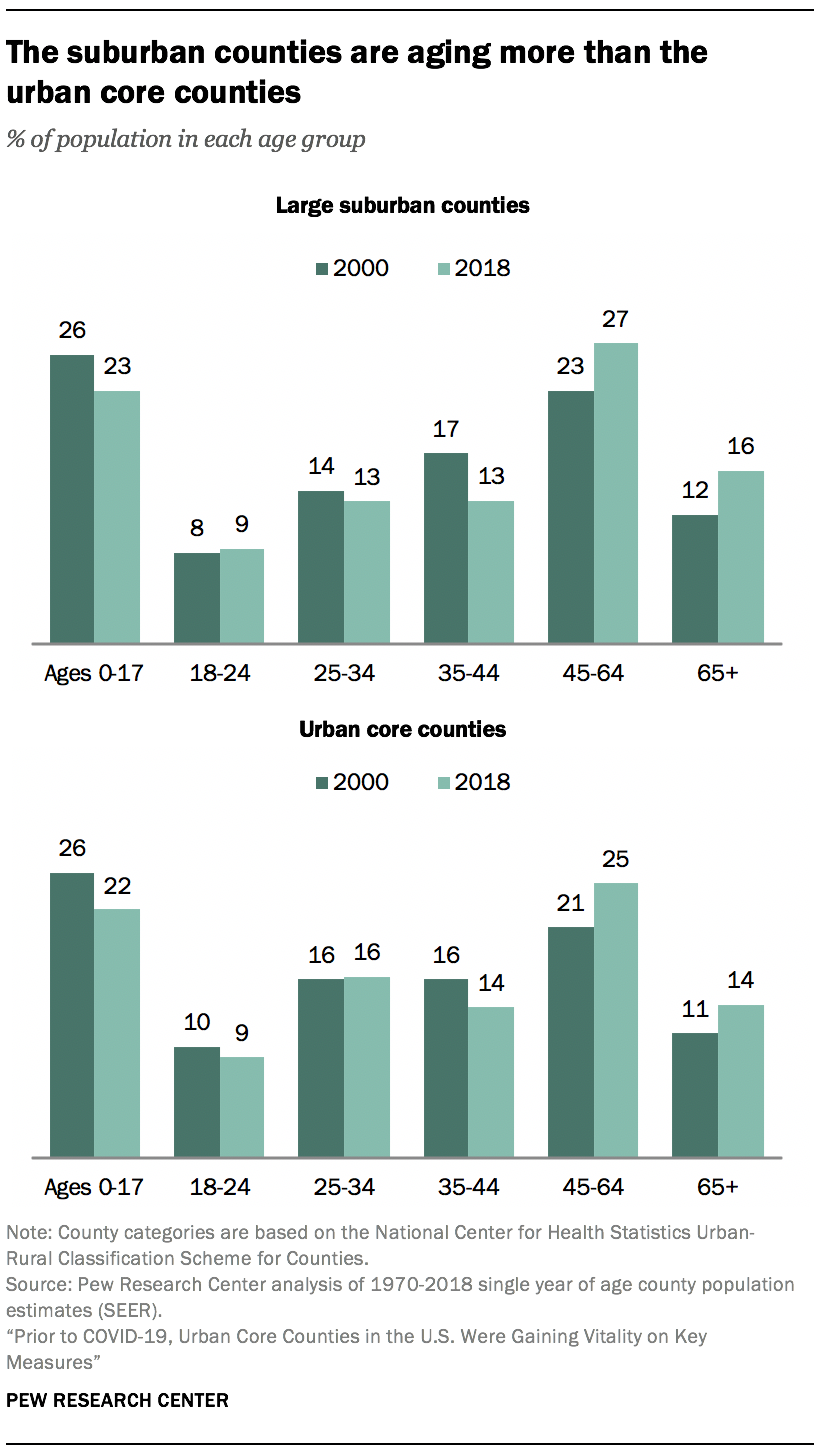
The share of suburban county residents who are age 65 and older increased from 12% (2000) to 16% (2018). Urban core counties are also aging, but not as much – 14% of their residents are seniors, up from 11% in 2000.
In 2000, children represented some 26% of the population in both the suburban counties and urban counties. Children now make up a smaller share of the population, especially in the urban core counties (22% versus 23% in suburbia). As far as 18- to 24-year-olds, they are a growing presence in the suburban counties (rising from 8% in 2000 to 9% in 2018), but a declining proportion of the population in the urban core counties.
The suburban counties now have a smaller share of their populations in the 25 to 34 and 35 to 44 age ranges compared with 2000. The population share of 25- to 34-year-olds declined from 14% (2000) to 13% (2018) in the large suburban counties, as did the population of 35- to 44-year-olds (from 17% to 13%).
The decline in the share of the population who are ages 25 t0 44 has been more modest in the urban core counties. The 25- to 34-year-old population has remained steady at 16%, while the presence of 35- to 44-year-olds has waned (from 16% to 14%), but not as steeply as has been the case in the suburbs.
In both the suburban counties and the urban core counties, 45- to 64-year-olds are now the largest age group in the population, and the 45- to 64-year-old share of the population has increased by 4 percentage points in both suburbs and central cities since 2000.
Since 2000, the population in the large suburban counties has increasingly comprised those who are often considered dependents (going from 46% in 2000 to 47% in 2018).2 During the same period, the share of dependents among the urban core population fell from 47% to 45%. Rising dependency represents a fiscal challenge for suburban counties, as children and the elderly require public services such as schools, colleges and senior centers, and they may not be contributing much to the local tax base.
The general pattern of the hollowing out of the distribution of the suburban population of large metropolitan areas – relatively fewer 25- to 44-year-olds, more seniors and children and more 18- to 24-year-olds – generally holds in every region of the country (see the Appendix).
Suburban gains lagging those of urban core counties in several dimensions
As central cities have outpaced the outlying suburban counties in attracting prime working-age adults, and large suburbs have grown in size at each end of the age spectrum, some of the long-standing suburban advantages relative to the central city have been narrowed or even reversed in the new century.
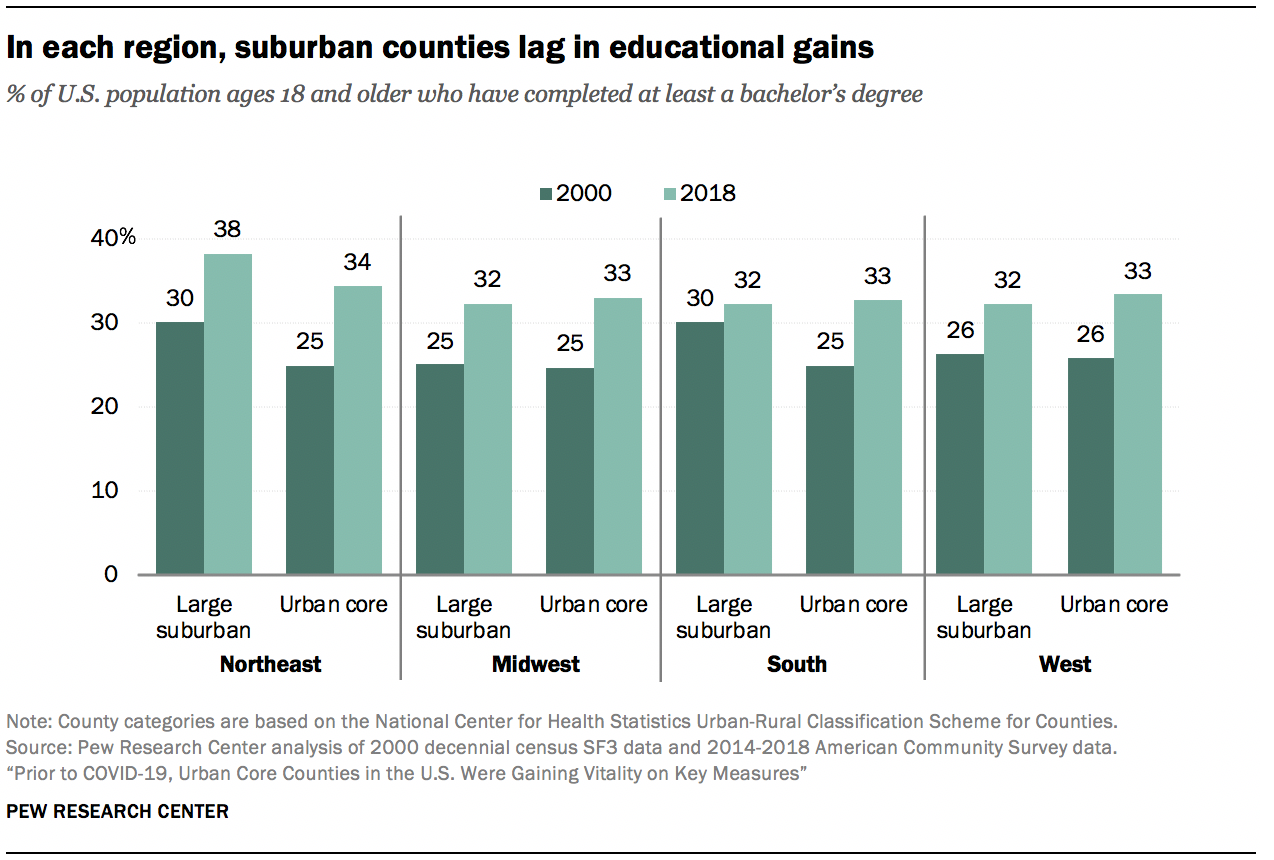
The nation’s adults have become increasingly educated, and this is true among adults in large suburban counties as well as those in the urban core counties. The education gains have been modestly larger in the urban core than the surrounding suburban counties. Some 34% of adults in suburban counties have completed at least a bachelor’s degree, up from 27% in 2000. In the urban core, 33% of adults have finished college, up from 25% in 2000.
Although there are likely additional factors at play, lagging educational gains in the suburban counties is to be expected given their changing populations. Older adults are less likely to have completed college than younger adults. And many 18- to 24-year-olds have yet to finish their education.
Immigration may also be contributing to the educational convergence between suburbs and their urban core counterparts. Immigration has impacted the suburbs more in the 21st century than the urban core counties. The foreign-born share of the population rose 4 percentage points since 2000 in the suburbs but only 2 points in the urban core counties. Though immigrants are about as likely as the native-born population to have finished at least a bachelor’s degree, a significantly larger proportion of them have no schooling beyond high school compared with the U.S.-born population.
The educational convergences are most marked in the large metros of the South. In 2000, suburban adults in the Southern metro areas were significantly more educated (30%) than their urban core peers (25%). Now, the Southern suburbs trail the educational attainment of the core counties (32% and 33%, respectively).
Among those of working age, in 2000, suburbanites were substantially more likely to be employed (64%) than their central city peers (59%). Job holding has declined among suburban working-age adults but increased in the urban core counties such that employment rates have converged (62% in suburbia versus 61% in the urban core). Converging employment rates between city and suburb are seen in all regions of the country.
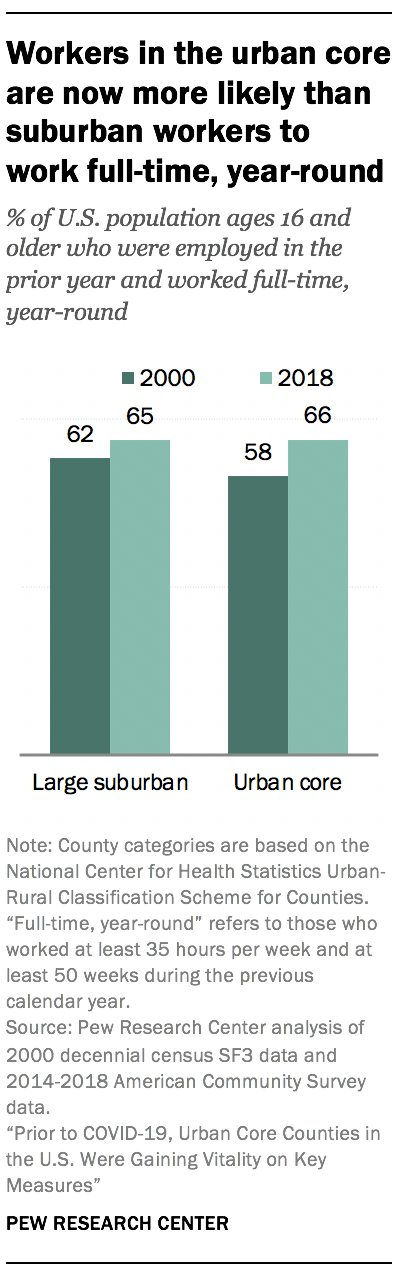
A shift in the intensity of work effort is apparent as well. In 2000, 62% of workers in the suburban counties of large metros worked full-time, year-round, outpacing the 58% of workers in the urban core putting in those work hours. That suburban advantage has also dissipated, as most recently 66% of urban core workers were full-time, year-round compared with 65% of suburban workers.
Changing demographics likely play a role in the flagging employment efforts of suburban working-age adults. Both 16- to 24-year-olds and those 65 and older are less likely to be employed than other adults.
The reduced vigor of suburban populations relative to the urban core counties is also apparent in Census income data. Examining first income per person, the per capita income of suburban counties in 2018 was about $38,000, compared with $39,000 in 2000 (in 2018 dollars). In contrast, per capita incomes in the urban core counties have risen from $34,000 in 2000 to $35,000 in 2018. This is not startling, since children don’t generate much income, 18- to 24-year-olds have below-average income, and adults 65 and older – all groups that are a growing proportion of the population in the suburbs – tend to have per capita incomes below the national average.
When it comes to average household income, the large suburban counties ($101,000) have not returned to their 2000 level ($103,000), while average household income in the urban core counties ($92,000) has modestly surpassed that of 2000 ($90,000).
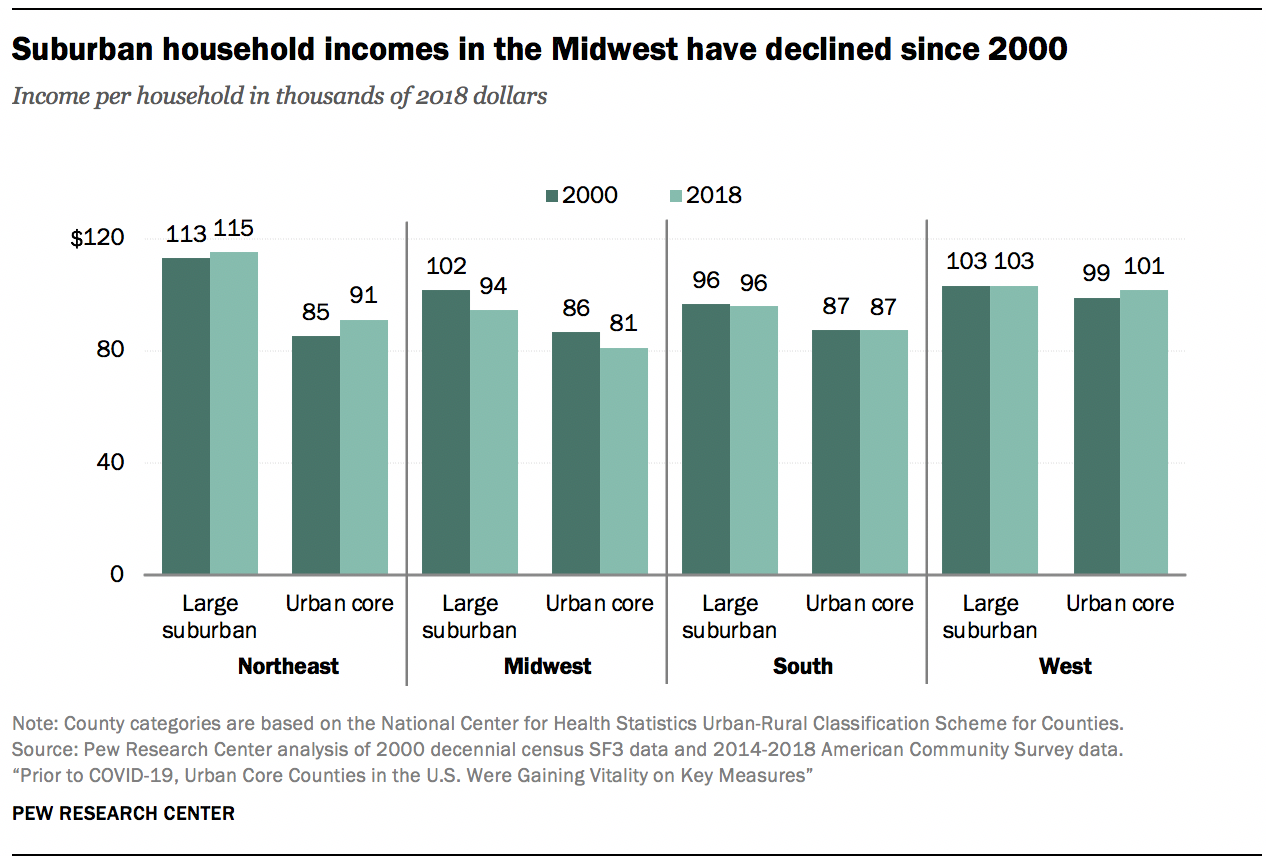
The largest decline in average household income occurred in the suburban counties of the Midwest. Income per household in the Midwest suburbs fell from $102,000 in 2000 to only $94,000 in 2018. Average household income has also fallen in the Midwest urban core counties, but not as much. Suburbs in the Northeast metro areas have seen gains in household income (from $113,000 in 2000 to $115,000 in 2018), but this trails the income gains of their urban core counterparts.
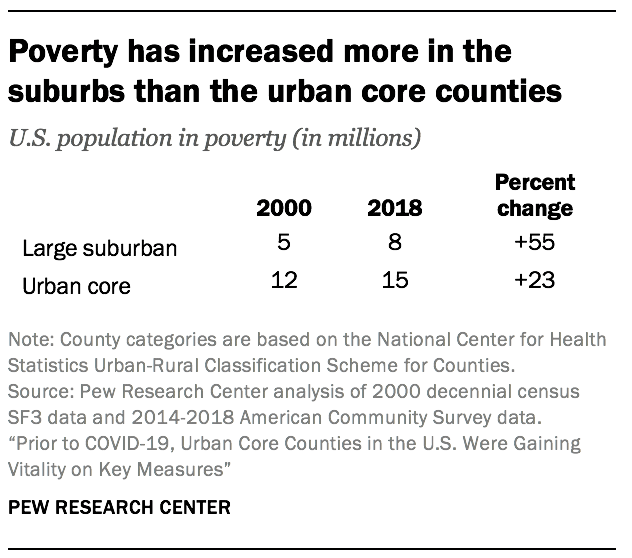
In addition to experiencing declining incomes, suburban counties in the 52 largest metro areas have also seen a sharper increase in poverty than have urban core counties. The population in poverty has increased by about 3 million since 2000 in each county type, but this represents a 55% increase in the suburbs compared with a 23% increase in central city counties, because the number of people in poverty in the suburbs was smaller than in the urban core. It is worth noting that poverty has increased throughout the U.S. since 2000, following two national economic downturns.
Turning to housing market vitality, home value appreciation in the large suburban counties has lagged behind the urban core counties (home values in this analysis are based on owner self-reports). The average home value in the suburbs stands at $333,000, up from $270,000 in 2000. Home values in the urban core counties, which were similar to those in the suburbs in 2000 ($275,000), are now at $402,000. Average home values are very different across the nation’s regions, but in every region suburban appreciation has trailed the rise in home values of the urban core counties.
However, when it comes home ownership, suburban and urban counties have seen declines of similar magnitude. In the suburbs, 70% of households own their homes, down from 73% in 2000. In the urban core counties, 53% of households are homeowners, down from 55% in 2000.


