How did people across 24 nations rate the political environment in their country in 2023? In a word: poorly.
- Few are satisfied with how democracy is working, and in most countries, the share of the public that is satisfied with democracy has decreased since the last time the question was asked.
- While there is a wide range of attitudes toward the political leaders across the 24 countries surveyed, a median of only 45% rate the leader of their country positively. Even fewer have favorable views of opposition leaders in their country.
- In most countries, the public rates major political parties negatively.
Satisfaction with democracy
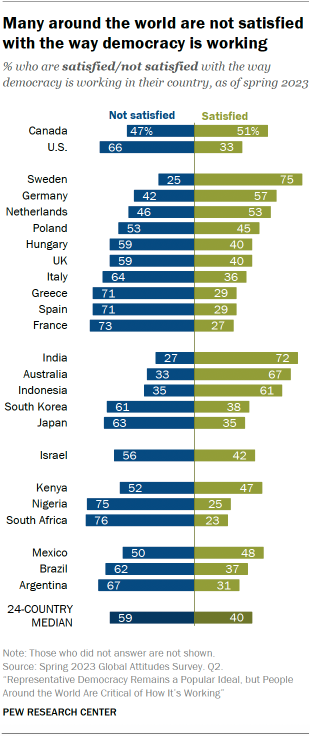
Ratings of democracy are generally negative across the 24 countries surveyed. A median of 59% say they are dissatisfied with the way democracy is working in their country. Half or more in 17 countries hold this view.
Nearly two-thirds of Americans are dissatisfied with how democracy is functioning in the U.S. Seven-in-ten or more in France, Greece and Spain are also dissatisfied with the state of their democracy.
Nigerians, who were polled soon after their national election in February 2023, are among the most dissatisfied (75%), along with South Africans (76%).
While negative views of democracy are fairly widespread, a few countries stand out for their high levels of satisfaction. For example, roughly three-quarters of Swedes and Indians are happy with the way democracy is working in their country.
Changes in satisfaction with democracy over time
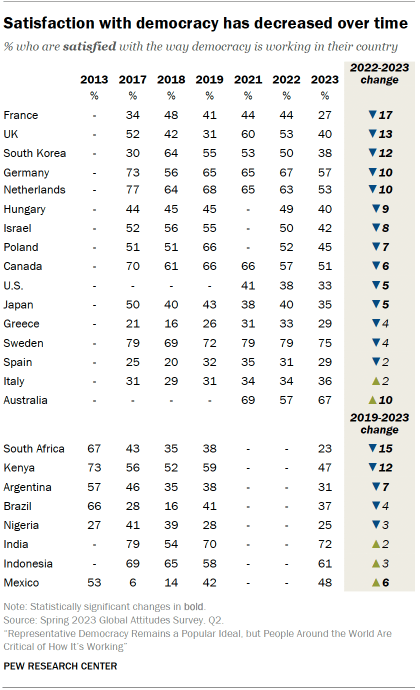
In 14 of 24 countries, satisfaction with democracy has decreased significantly since the last time this question was asked.
The largest drop can be seen in France, with a 17 percentage point decrease in satisfaction between 2022 and 2023.
There are only two countries where satisfaction with democracy has increased significantly in recent years: Australia (compared with 2022) and Mexico (since 2019).
Factors impacting satisfaction with democracy
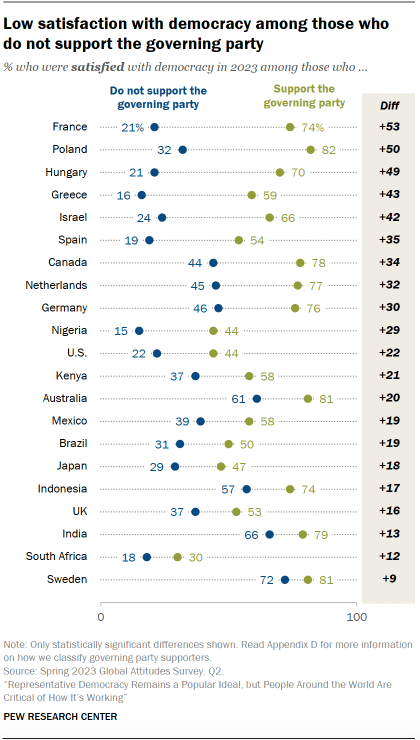
Support for the governing party: Of course, people who support the party in power are much more likely to be satisfied with democracy in their country than people who don’t support the governing party.
The difference between these groups can be very large. For example, 70% of Hungarians who support Fidesz are satisfied with democracy, compared with only 21% of those who don’t support the party.
Yet, in some countries, even supporters of the governing party or coalition have relatively low levels of satisfaction.
Economic situation: In every country surveyed, people who think the current economic situation in their country is good are much more likely to also be content with how democracy is working.
Poland is a good example of this pattern: 88% of Poles who say the economic situation is good are satisfied with democracy, while only 23% among those who think the economic situation is bad agree.
Views of national leaders, opposition leaders and political parties
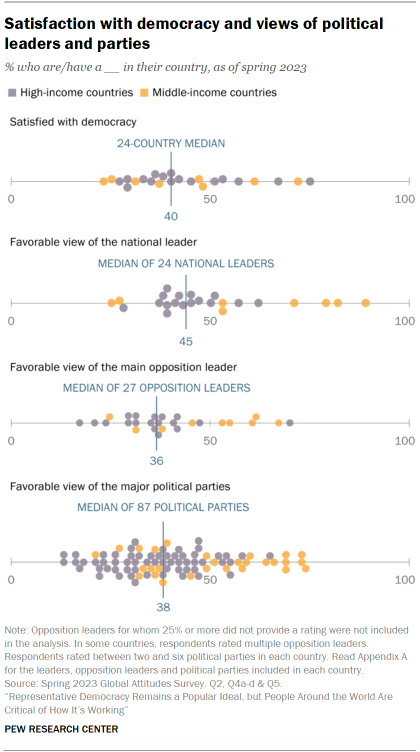
Mirroring the dissatisfaction many people feel with the way democracy is working, people across the countries surveyed generally do not have very positive views of their country’s major political leaders or parties.
A median of 45% have a favorable view of the head of their government or head of state, while 52% have a negative opinion.
Despite many political leaders receiving lukewarm ratings, their opposition generally fares worse. A median of just 36% of people rate the opposition leaders in their country favorably. This analysis includes ratings for 27 leaders across the countries polled.
Our survey also asked people to rate their views of between two and six major political parties in their country, including governing and opposition parties. Across the countries surveyed, people rated a total of 87 political parties. Of these, only 21 received positive ratings from half or more of the public.
In many of the countries surveyed, none of the parties we asked about were rated positively by more than half of people.
For example, Canadians rated their country’s three largest federal parties: the Liberal Party, the Conservative Party and the New Democratic Party. Only around 45% of Canadians had a positive rating of each one.
Factors impacting views of national leaders
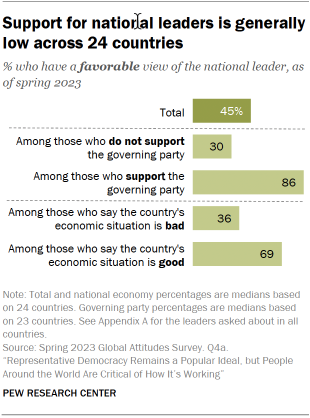
Support for the governing party: In almost every country polled, views of national leaders are much more positive among people who support the leader’s party or coalition.
Economic situation: As with views of democracy, economic ratings can impact how people feel about their country’s leader. Among those who think their country’s economy is doing well, a median of 69% have a favorable view of the leader. Just over a third of those who think their economy is doing poorly have a favorable assessment of their country’s leader.
Age: In 11 countries, people 40 and older have more positive views of their leader than adults under 40.
Read “Views about political representation” for more about how people feel about elected officials and political parties in their country.
CORRECTION (March 20, 2024): A previous version of the chart showing favorability of national leaders by view of the economy included an incorrect data label. The chart has been updated with the correct label.


