The Sept. 11, 2001, terrorist attacks played a key role in shaping the U.S. government’s current system for foreign student visas. In the years after Sept. 11, the federal government fully implemented the automated foreign student monitoring system, and student visa applications began receiving additional scrutiny.
Populations of analysis and data access
The OPT data for this study are from the federal government’s automated foreign student monitoring system, the Student and Exchange Visitor Information System (SEVIS). Information added into SEVIS is self-recorded and contains information about F-1 visa holders that have been approved for the Optional Practical Training (OPT) program extension. The data in this analysis include information on graduates’ country of citizenship, major, level of education, name and location of their educational institution, employer name and location, and approval start and end years. Only foreign individuals who pursued degrees in higher education (associate, bachelor’s, master’s and doctorate) were included in our analysis. Foreign graduates on OPT who attended schools in Puerto Rico are included in this analysis; however, those who graduated from or are currently working in other U.S. territories (such as Guam and the U.S. Virgin Islands) are not. These individuals accounted for less than 0.02% of the population.
Geographical classification of Metropolitan Statistical Areas
Respondents’ city and state level data in the OPT dataset (school address and current address) were matched to their corresponding Metropolitan Statistical Areas (MSAs) as classified by the Office of Management and Budget.18 Because the raw data contained numerous typographical and other contextual errors, the raw entries for city and state were preprocessed by standardizing prefixes common to cities and towns (such as “saint” or “heights”) and by removing digits and punctuation. For each entry, we then looked up a list of all cities and towns in that state, found a matching city, and returned its corresponding MSA. In cases where errors in the raw data resulted in failure to return an exact match to the city, approximate string matching using the restricted Damerau-Levenshtein distance metric was used to find the closest matching city up to a maximum string distance of 3. Locations that are not categorized under any MSA were coded as “non-metropolitans” (these include Micropolitan Statistical Areas) and were not included in our analysis. About 3% of entries could not be programmatically matched in this way, and were therefore manually coded into their corresponding metro areas. Of this 3%, less than 0.5% could not be manually matched.19
This report’s accompanying sortable table focuses on 113 MSAs that had at least 2,000 foreign student graduates approved for OPT during the 2004 to 2016 period.20 The interactive associated with this report includes 61 metro areas with 5,000 or more foreign student graduates.21
Carnegie Classification of Institutions of Higher Education (CCIHE)
The Carnegie Classification of Institutions (specifically their “control” variable) was used to categorize schools into public, private nonprofit or private for-profit institutions. Colleges and universities that were not included in the classification encompassed less than 3% of the foreign graduate population on OPT.22 These schools were coded as “non-CCIHE classified” in our analysis.
Major classifications
This report groups majors based on the taxonomic scheme from the U.S. Department of Education’s Classification of Instructional Programs which supports the accurate tracking and reporting of fields of study.23 The most recent delineation of majors that fall under the science, technology, engineering or mathematics (STEM) fields outlined by the Department of Homeland Security was used to determine the individuals who are eligible to apply for the additional 24 months OPT program expansion.
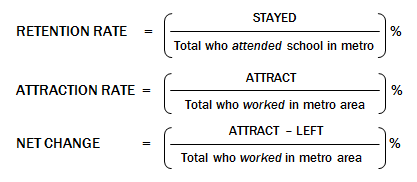
Calculating retention, attraction and net change
By comparing individual-level locations of schools and current addresses, we were able to calculate the total number and breakdown of foreign graduates who stayed in (retention) or left (outflow) their school’s metro area, as well as the total who were attracted to other metro areas and relocated (inflow) there. The variables and formulas below were used to define and calculate the numbers used in our analysis.
STAYED = Total who attended school in metro and stayed to work
LEFT = Total who attended school in metro and left for other metros to work
ATTRACT = Total who arrived from other metros to work