Chinese Americans view the United States more favorably than any other place asked about in the survey.5 About three-quarters hold a favorable view of it, including about three-in-ten who see the U.S. very favorably. Japan, Taiwan and South Korea are other places that majorities of Chinese Americans see favorably, our survey analysis finds.
About four-in-ten Chinese Americans see China in a positive light, and around a third (35%) see the country unfavorably. Roughly a fifth say they have a neither favorable nor unfavorable view of China. Chinese adults stand out for being one of the few origin groups that rate other Asian places more favorably than their own place of origin – more Chinese Americans say they have positive views of Japan, Taiwan and South Korea than China.
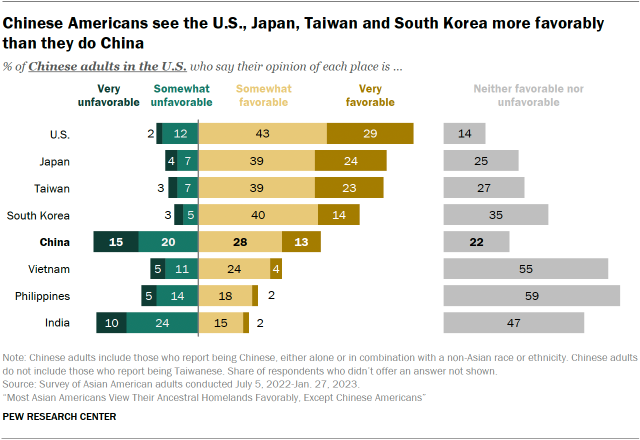
On the Philippines, Vietnam and India, Chinese adults generally hold neutral opinions. About half or more say they have a neither favorable nor unfavorable view of each place.
How Chinese Americans’ views differ from those of other Asian Americans
Chinese Americans’ views of the places asked about tend to differ substantially from those of other Asian American adults.6 The difference is greatest when it comes to China, which only 14% of other Asian adults see favorably (compared with 41% of Chinese adults). They are also more likely than other Asian adults to see Taiwan favorably (62% vs. 55%).
Outside of these two places, though, Chinese Americans tend to have less favorable views when compared with other Asian adults. For example, while 42% of other Asian Americans see the Philippines favorably, only 20% of Chinese Americans do.
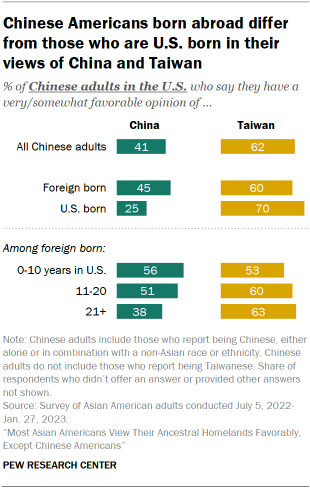
More time spent in the U.S. is associated with less favorable views of China, more favorable views of Taiwan
The number of years Chinese Americans have lived in the U.S. is related to how they see China and Taiwan.
On views of China, those who were born in the U.S. are much less likely to hold a positive view of China than those who were born abroad (25% vs. 45%). And, among immigrants, those who have been in the U.S. longer tend to feel much less positively about China than those who immigrated more recently.
When it comes to favorability of Taiwan, U.S.-born Chinese Americans are more likely to see Taiwan favorably than Chinese immigrants (70% vs. 60%).
Chinese Americans mostly uninterested in moving to China
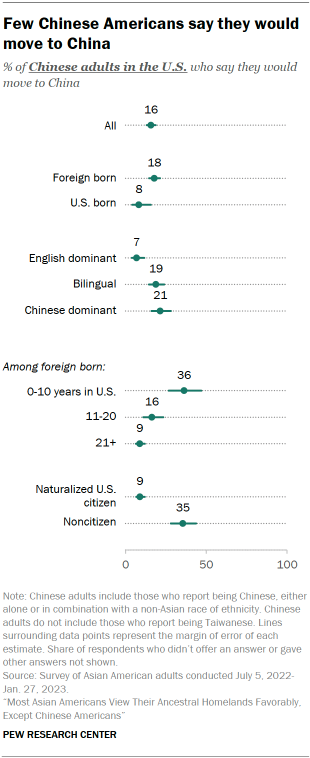
Though a plurality of Chinese Americans hold a favorable view of China, few are interested in moving there. About eight-in-ten say they would not move to China, compared with 16% who say they would.
Chinese Americans who are bilingual or whose primary language is a Chinese dialect are somewhat more likely to be interested or willing to move to China than those who are English dominant. While about one-in-five bilingual or Chinese-dominant Chinese Americans say they would ever move to China, only 7% of English-dominant Chinese Americans would ever do the same.
“I have high hopes for the Chinese language. For example, mainland China has become strong in power [recently], so if there are fewer opportunities in the United States, you could still go back to Hong Kong, Taiwan or mainland China. To me, even if we were born here, we ultimately do not really belong here.”
– Immigrant woman of Chinese origin, age 47 (translated from Mandarin)
Among Chinese Americans born outside of the U.S., citizenship status plays a role in how they see moving to China. Noncitizens are much more likely than citizens to say they would move to China.
Likewise, immigrants who have been in the U.S. for longer are less likely to say they would move to China: Whereas less than a fifth of those who have spent more than 10 years in the U.S. express a willingness to move back to China, about a third of those who have been in the U.S. for 10 years or less (36%) would ever move back.
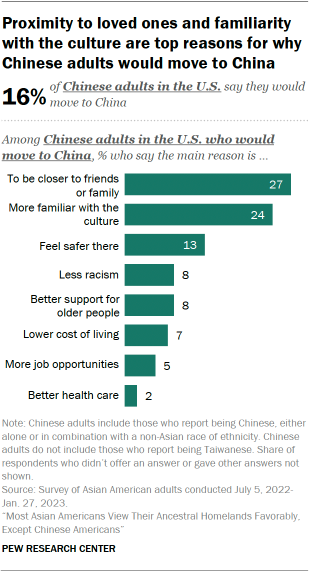
Among Chinese Americans who would move to China, being closer to friends or family and more familiarity with the culture are the most common reasons for considering doing so (about a quarter each). Some 13% say they would feel safer in China, while others point to less racism (8%), better elder care (8%), and lower cost of living (7%) as the primary factor.
“[F]or me, I would not say that it would be better or bad for personal development to stay in the United States, or return to the homeland, but that if this would be what I want, and I am able to make it, that would be good.”
– Immigrant woman of Chinese origin, age 29 (translated from Mandarin)


